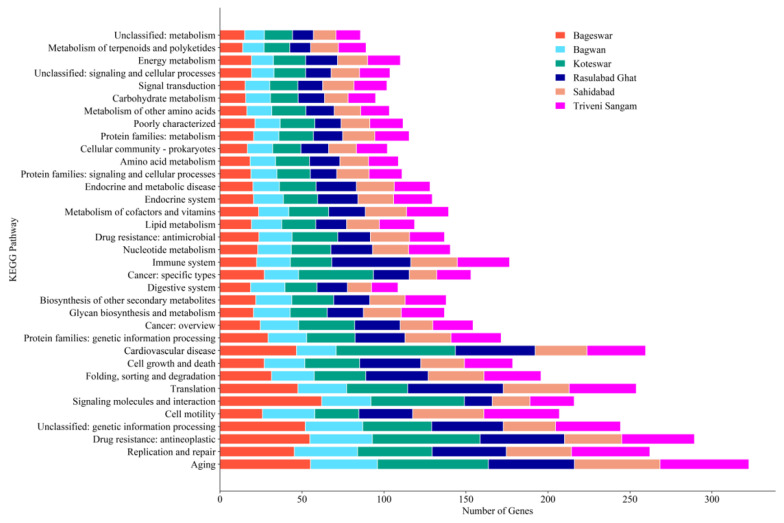
Figure 7.
Graphical representation of the distribution of various biological processes in the Ganga River basin as analyzed from the KEGG. It depicts a comparative analysis across the six locations (Bageswar, Bagwan, Koteswar, Rasulabad Ghat, Sahidabad, and Triveni Sangam), showing the frequency of processes ranging from aging and replication to metabolism and drug resistance.

