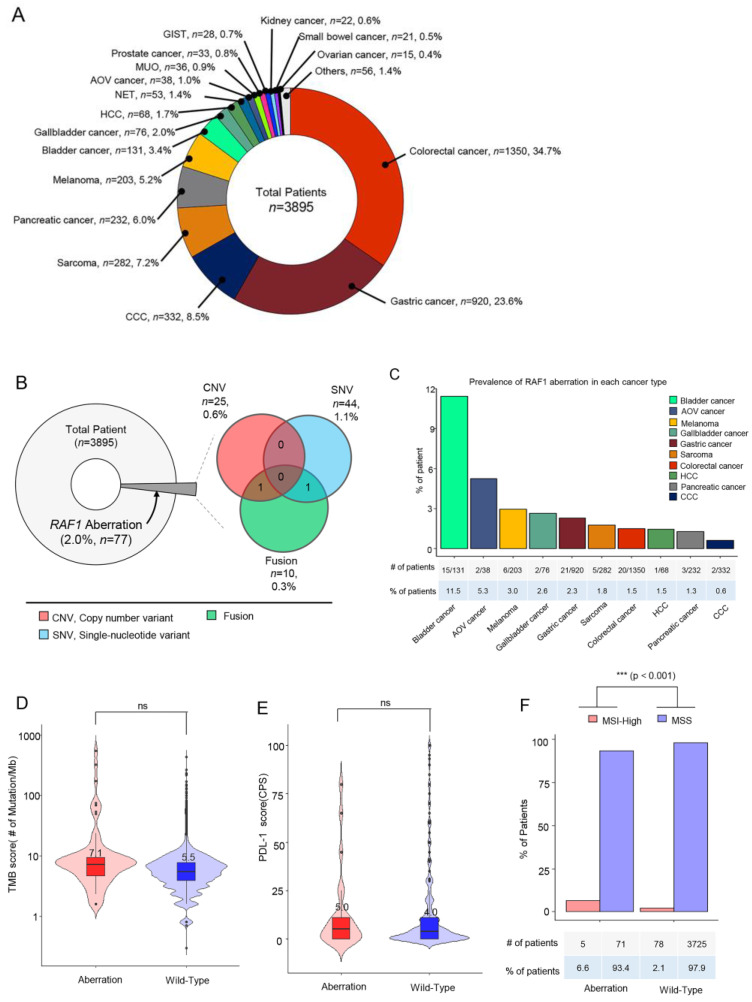
Figure 1.
Overview of the enrolled cancer patients and the proportions of RAF1 genetic variants. (A) Between October 2019 and June 2023, all patients with stage IV cancer at the Precision Oncology Clinic of Samsung Medical Center were screened for RAF1 aberrations through next-generation sequencing using a panel targeting 500+ genes (TruSight Oncology Next Seq). A pie chart indicating the percentages of each type of cancer in a total of 3895 patients. (B) A pie chart representing the proportion of patients with any RAF1 aberration (left), and a Venn diagram showing the number and percentage of patients with RAF1 CNVs (amplifications), SNVs, and fusions. (C) The proportion of patients with RAF1 aberrations according to each cancer type. (D) The TMB scores between tumors with RAF1 aberrations and wild-type tumors. (E) The PD-L1 scores between tumors with RAF1 aberrations and wild-type tumors. ‘ns’ (F) The percentage of patients with MSI-H tumors between tumors with RAF1 aberrations and wild-type tumors. Statistical significance was assessed by the U-test. p-values < 0.05 were considered significant; (***) p-value < 0.001; ns = not significant.

