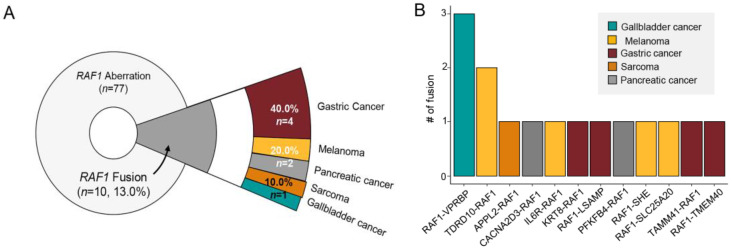
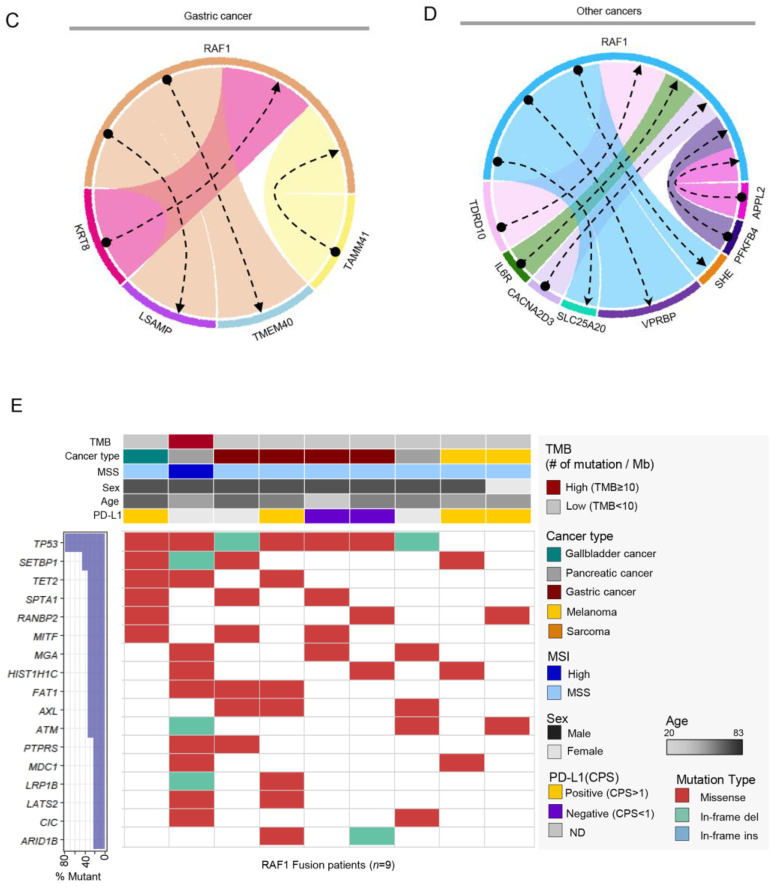
Figure 4.
(A) Pie chart showing the distribution of cancer patient groups containing fused RAF1 genes: GC (n = 4, 40%), melanoma (n = 2, 20%), and pancreatic cancer (n = 2, 20%) in order of the most frequently occurring tumor types. (B) The fusion number in each type of fused RAF1 genes. Network diagram representing RAF1 and fusion partner genes in GCs (C) and other cancers (D). (E) Landscape of the RAF1-fused patient’s genomic profile comprising the TMB score, cancer type, MSI status, sex, age, and PD-L1 (top panel). OncoPrint showing SNV of other genes (bottom panel); left panel: the percentage of mutations in the total sample (RAF1-fusion patients; n = 10).


