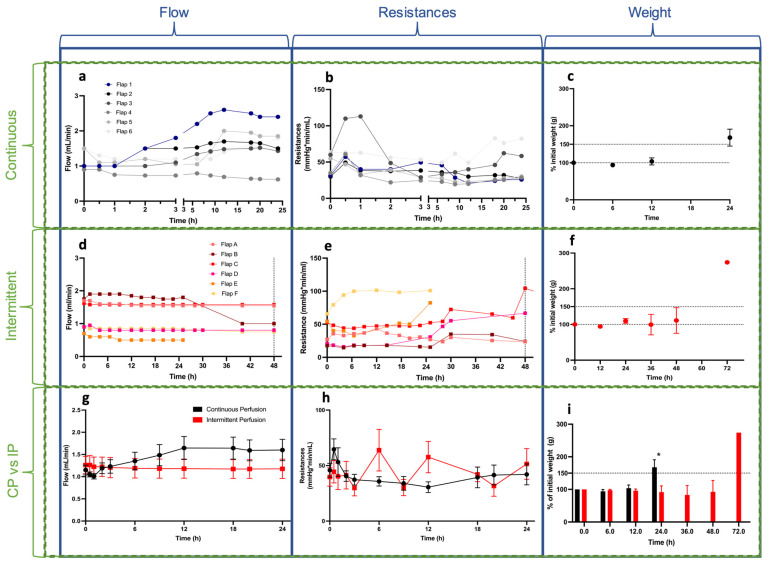
Figure 2.
Perfusion parameters. The first, second, and third rows display the continuous perfusion group, the intermittent perfusion group, and the statistical analysis between groups, respectively. (a,d,g) Flow (b,e,h), resistance, and (c,f,i) weight variation are shown. Overall flow and resistances were comparable between groups. Edema was statistically lower in the I.P. group at 24 h. Mean weight gain at 36 and 48 h was lower in the I.P. group compared to the C.P. group at 24 h. Please note that the x-axis is split in (a,b) (continuous) into 0–3 h and 3–24 h to allow for better viewing of the initial three-hour results. For the I.P. group, the flow and resistance were the mean value per perfusion cycle (4 values per cycle). Values for the I.P. were collected for 48 h of perfusion. The third row shows mean values ± S.E.M. * statistically significant.

