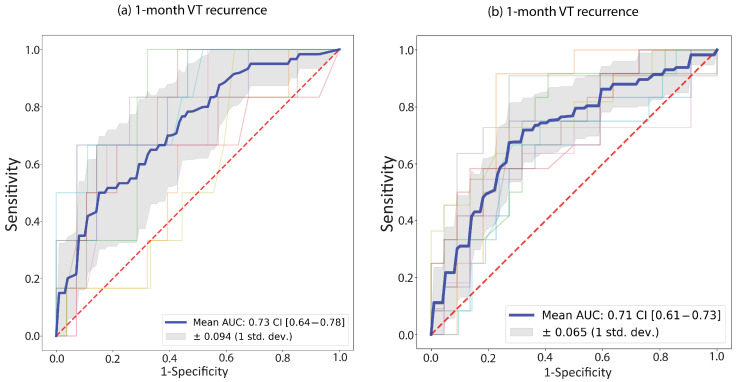
Figure 3.
Receiver Operating Curves (ROC) for the two random forest models; (a) 1-month recurrence model; (b) 1-year recurrence model. ROC curves are plotted for each fold in the 10-fold cross-validation (faded colored lines); the blue line represents their average. The grey shaded area shows the standard deviation of the ten ROC curves. The legend shows the area under the average ROC (“Mean AUC”) with the 95% confidence interval (“CI”).

