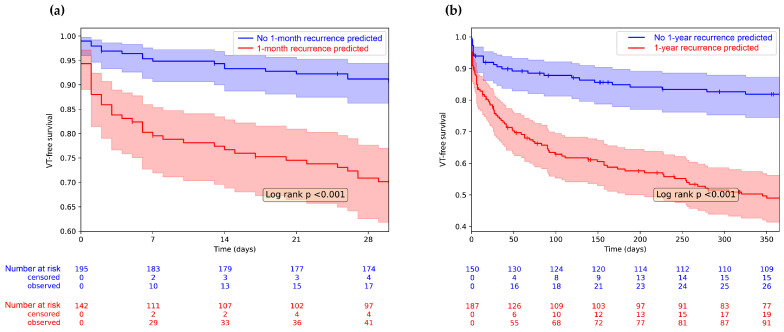
Figure 4.
Kaplan–Meyer analysis showing 1-year VT recurrence based on the model prediction. Censored cases are symbolized using vertical lines on the survival curves. (a) We divided the population based on the prediction of the 1-month VT recurrence model and the VT-free survival of the two groups is plotted with 1-month follow-up; (b) The entire population was divided based on the prediction of the 1-year VT recurrence model and the VT-free survival of the two groups is plotted with 1-year follow-up. Shaded areas show 95% confidence intervals. VT-free survival of the two groups is compared with the Log-Rank test; the inset shows the p value.

