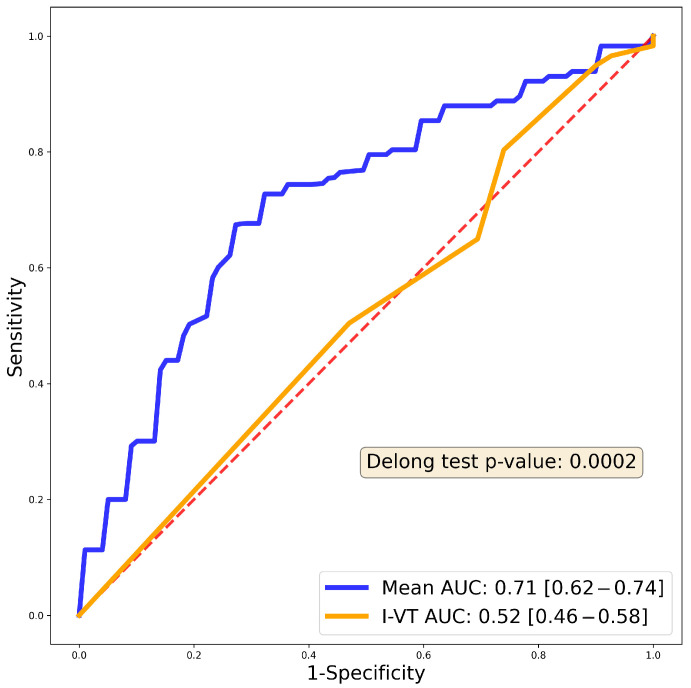
Figure 5.
Receiver Operating Curve (ROC) of the previously published I-VT score on our patient population compared to our 1-year predictive model. Blue curve shows the 1-year random forest AUC, while the orange curve shows the I-VT score AUC (0.52). The red dashed line is the reference line. DeLong test shows significantly better performance in the case of our predictive model (p value indicated in the inset).

