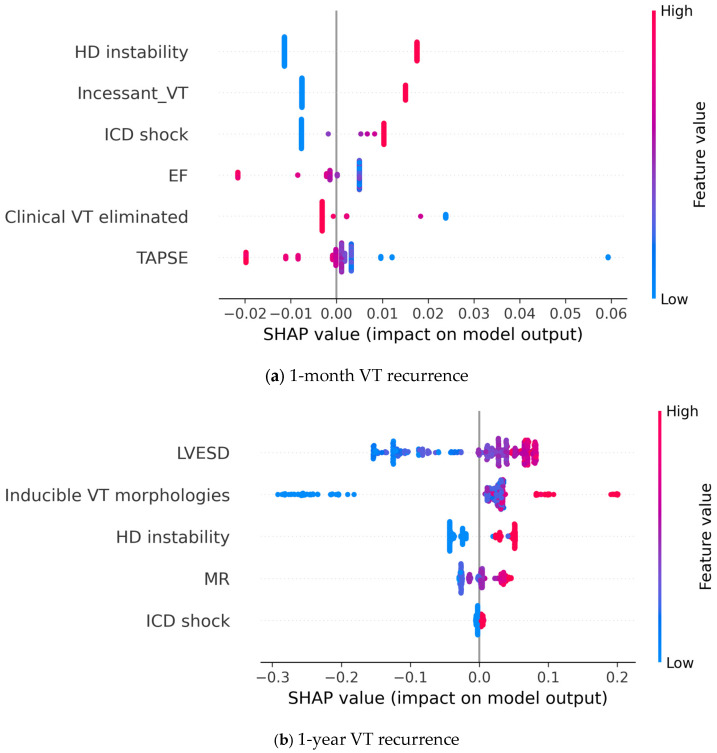
Figure 7.
SHAP analysis showing the contribution of individual input features to the model prediction output; (a) 1-year recurrence model; (b) 1-month recurrence model. Each point represents a patient case, where the color denotes the value of a given feature and the SHAP value shows the contribution of that given feature to the model output. EF: left ventricular ejection fraction; VT: ventricular tachycardia; TAPSE: tricuspid annular plane systolic excursion; ICD: implanted cardioverter defibrillator; LVESD: left ventricular end systolic diameter; HD: hemodynamic; MR: mitral regurgitation.

