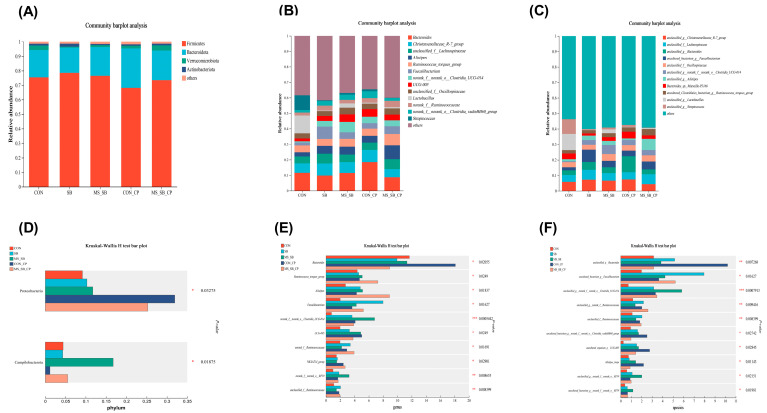
Figure 5.
The abundance of the microbial community in cecum content. (A–C) The top relative abundance of the microflora community between groups (phylum level, genus level, and species level). (D–F) The bacteria with significant differences between groups (phylum level, genus level, and species level). The column with * are statistically significant, * means p ˂ 0.05, ** means p ˂ 0.01, *** means p ˂ 0.001, n = 6.

