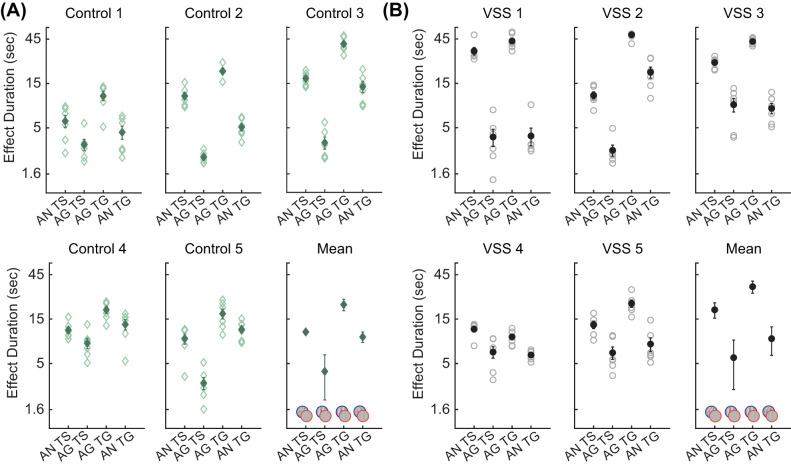
Figure 3.
Results of experiment 2. (A) Time until the test stimuli regained full strength is plotted for each of the four stimulus conditions (adapt to noise [AN] and test snow [TS], adapt to Gabor [AG] and test snow, adapt to Gabor and test Gabor [TG], and adapt to noise and test Gabor) for each of the five control observers and their means. Individual trials are shown in light markers and means are shown with darker markers. Error bars are as in Figure 2. (B) Results from five participants with VSS and their means.

