
Figure 4.
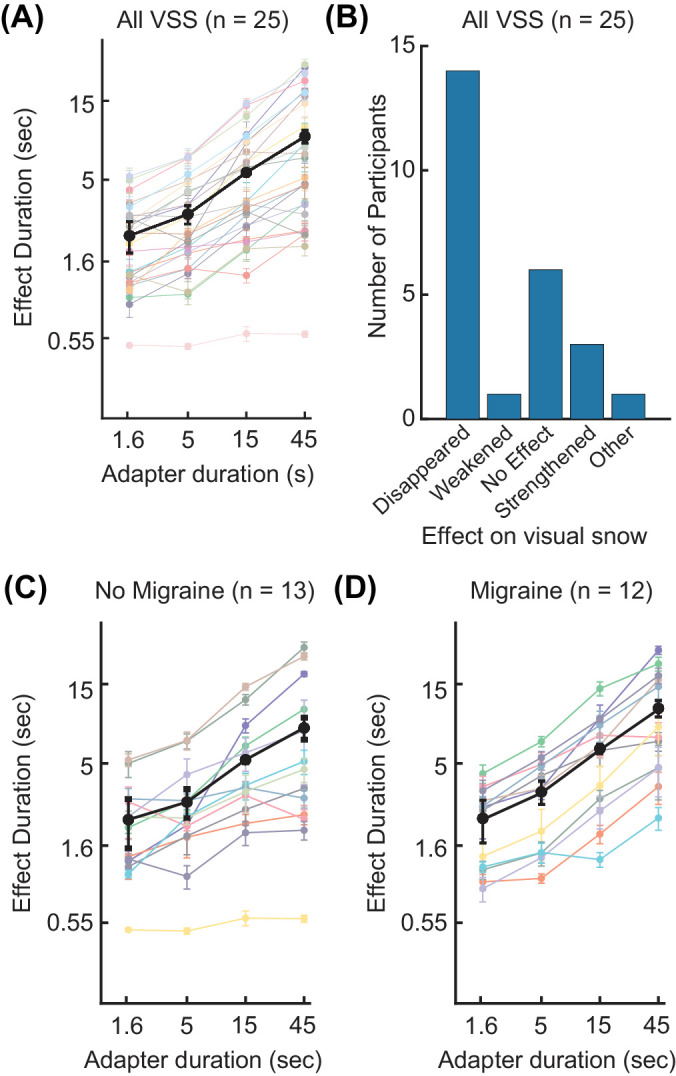
Results of experiment 3. (A) The average time in seconds until visual snow matched on the adapted and unadapted sides is plotted as a function of adapter duration for 25 participants with visual snow syndrome (color) with the mean across participants (black). Error bars are As in Figure 2. (B) A bar graph shows the number of participants who reported various perceptual effects of adaptation on their visual snow. Visual snow effect categories included disappearance, weakening, no effect, strengthening, and expanding outward from the center of the square. (C) The same as panel A, but showing participants with visual snow but without migraine (n = 13). (D) The same as panels A and C, but showing only participants with migraine and visual snow (n = 12).