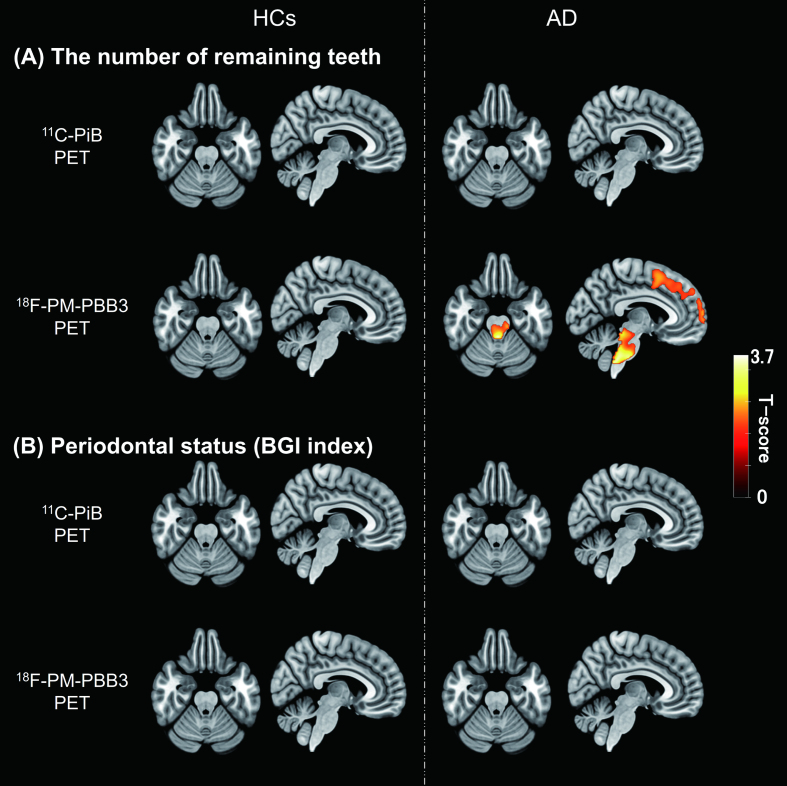
Fig. 2.
Correlations between oral parameters and PET tracer retention. A) T-score maps of correlation analyses between the number of remaining teeth and each PET tracer retention in HCs and AD-spectrum patients. B) T-score maps of correlation analyses between periodontal status (BGI index) and each PET tracer retention in HCs and AD-spectrum patients. Regions with significant correlations indicated an increase of tau PET tracer accumulation with a decrease in the number of remaining teeth (uncorrected, p < 0.05). The cluster size threshold was set to the expected voxel of each analysis. Results were expressed in the MNI coordinate space. AD, Alzheimer’s disease; BGI, biofilm–gingival interface; HCs, healthy controls; MNI, Montreal Neurological Institute; PET, positron emission tomography.

