
Figure 2.
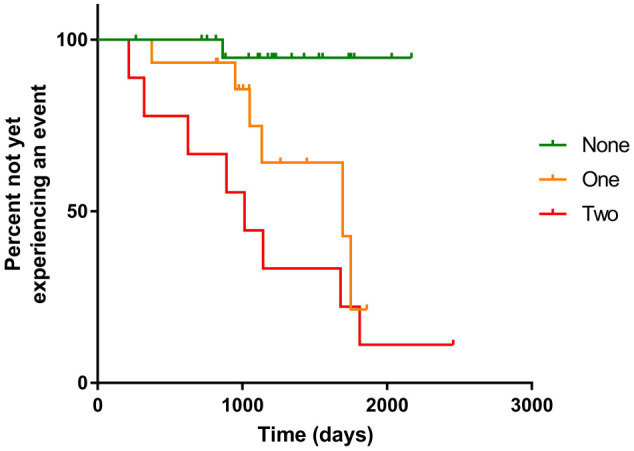
Kaplan–Meier plot indicating the proportion of cats that had not yet experienced an event against time according to whether they had none, one or two of the identified risk indicators above the proposed cut-off values
Official websites use .gov
A
.gov website belongs to an official
government organization in the United States.
Secure .gov websites use HTTPS
A lock (
) or https:// means you've safely
connected to the .gov website. Share sensitive
information only on official, secure websites.
Kaplan–Meier plot indicating the proportion of cats that had not yet experienced an event against time according to whether they had none, one or two of the identified risk indicators above the proposed cut-off values