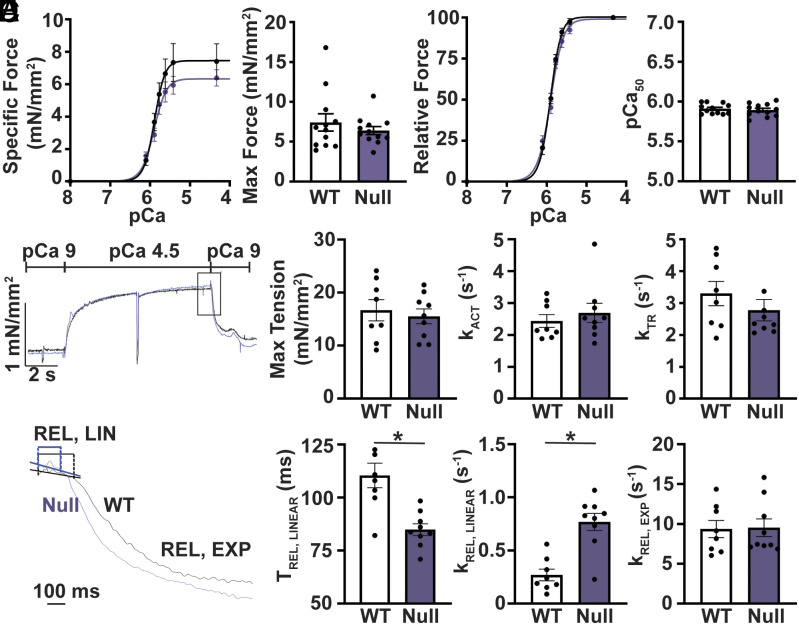
Fig. 4.
Loss of Mybphl increases relaxation kinetics. (A) Calcium-isometric force relationship of permeabilized isolated atrial cardiomyocytes from wild-type and Mybphl homozygous null hearts. N = WT: 5 mice, 16 cells; null: 4 mice, 13 cells. (B) Relative force traces from permeabilized isolated atrial cardiomyocytes from wild-type and Mybphl homozygous null hearts. N = WT: 5 mice, 16 cells; null: 4 mice, 13 cells. (C) Representative trace of single myofibril force measurements from WT and homozygous Mybphl null atria. The trace shows kinetics of force activation (kACT), redevelopment (kTR), and relaxation of WT and Mybphl myofibrils. (D) Expanded traces of myofibril relaxation showing the time and rate of the short linear phase (tREL, LINEAR, kREL, LINEAR) and the exponential phase (kREL, EXP) of relaxation. (E) Quantification of the single myofibril data. N = WT: 7 mice per group, averaged from 3 to 6 fibers per mouse. Null: 9 mice, averaged from 3 to 6 fibers per mouse. * = P < 0.05 by Welch’s t test.

