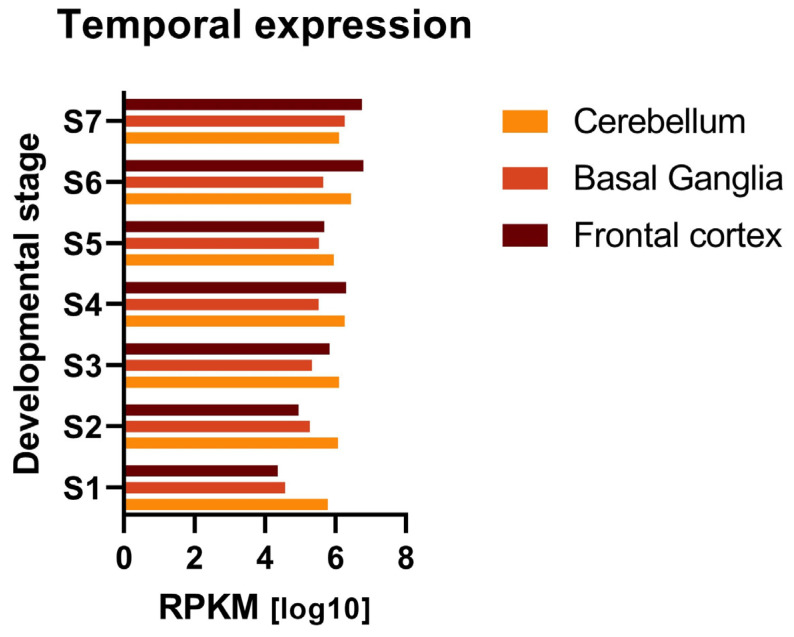
Figure 2.
Comparative temporal expression of the 12 DCD-associated genes across different developmental stages in the cerebellum, basal ganglia, and frontal cortex. Log10-transformed mean gene expression is depicted for each developmental stage (S1–S7) in the selected structures. Gene expression was available as reads per kilobase per million (RPKM). Comparison of average gene expression among the developmental stages between the cerebellum, basal ganglia, and frontal cortex showed no statistically significant difference after correcting for multiple comparisons. Mean, range, and standard deviation of each developmental stage in each of the three structures are reported in Supplementary Table S2. RPKM = reads per kilobase per million; S1 = 8–13 postconceptional weeks; S2 = 16–21 postconceptional weeks; S3 = 24–37 postconceptional weeks; S4: 0–1 years; S5 = 2–4 years; S6 = 8–13 years; S7 = 15–19 years.

