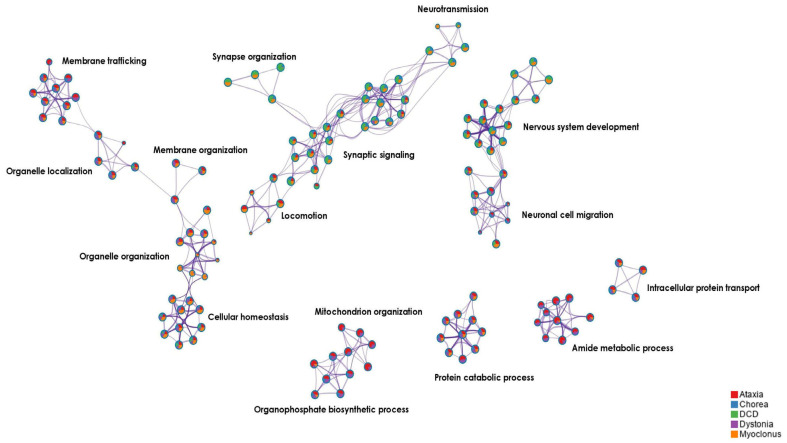
Figure 4.
Top significant biological pathways (depicted as clusters) enriched in the shared DCD-associated/MD gene co-expression network. Network plot of the top significant enriched biological pathways, depicted as clusters, in the shared DCD-associated/MD gene co-expression network. Similar biological pathways are grouped in clusters. Clusters are here represented as color-coded pie charts based on their enrichment for each gene group, where red = enriched for the ataxia genes, blue = enriched for the chorea genes, green = enriched for the DCD-associated genes, purple = enriched for the dystonia genes, and orange = enriched for the myoclonus genes. Clusters with similar biological functions are displayed in closer proximity to each other. The name of the cluster with the most significant p-value within each group is shown above.

