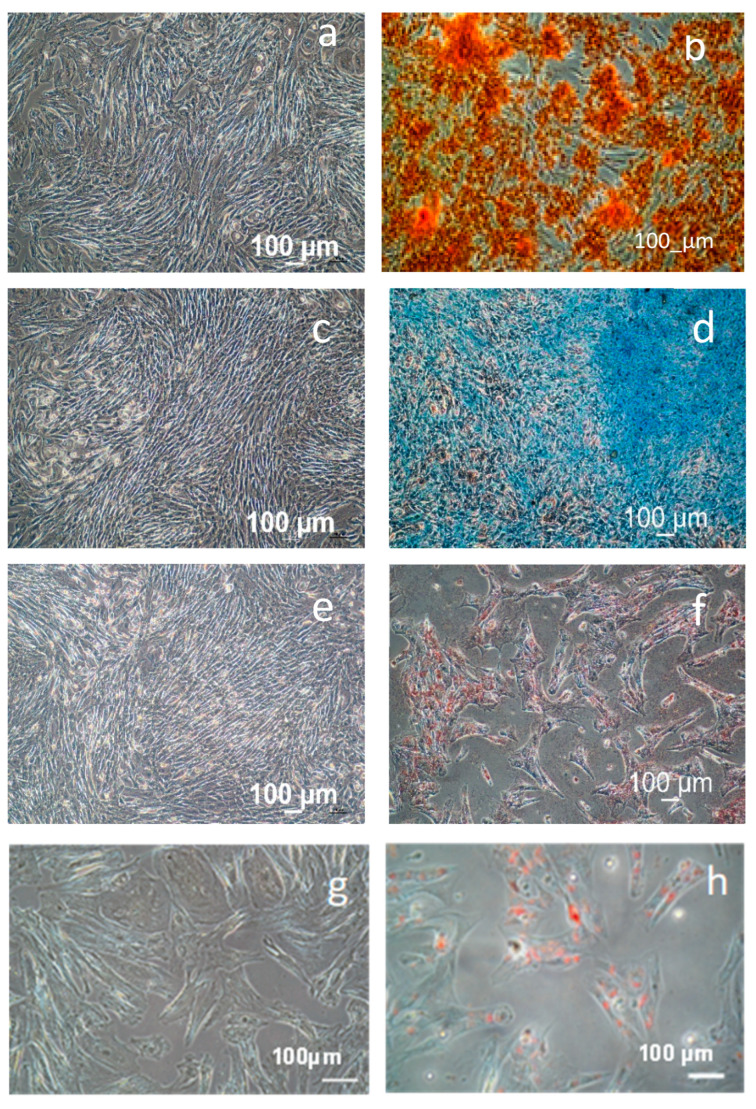
Figure 2.
Differentiation of cells after two weeks of treatment, as detailed in Section 2. (a,b) depict osteogenic differentiation, (c,d) illustrate chondrogenic differentiation, and images (e–g) and h demonstrate adipogenic differentiation. Images (a,c,e) serve as negative controls, representing AMSCs cultured solely in αMEM/10% FCS. The differentiated cells are depicted in images (b,d,f–h).

