Figure 5.
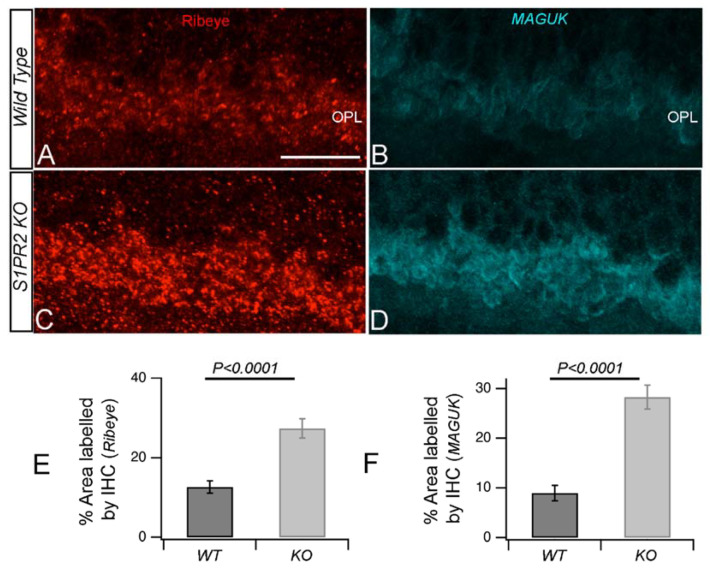
Synaptic structure in the OPL of WT and S1PR2 KO mice. (A–D) Transverse retinal cross-sections from WT (A,B) or S1PR2 KO (C,D) mice were immunostained with fluorescently labeled antibodies specific for synaptic ribbon marker ribeye (red, (A,C)) post-synaptic marker MAGUK (cyan, (B,D)). Maximal intensity projections are shown. Scale bar, 50 μm. (E,F) Quantitative analyses of IHC for accumulation of ribeye (E) and MAGUK (F) proteins in the OPL represent the average value of the area of expression and fluorescent intensity (Supplement Figure S4) in 4–6 animals sampled per condition in 3–5 independent experiments. Statistical relevance was determined using a two-tailed t-test; p < 0.0001. Abbreviations used: IHC, immunohistochemistry; KO, knockout; OPL, outer plexiform layer; WT, wild-type.

