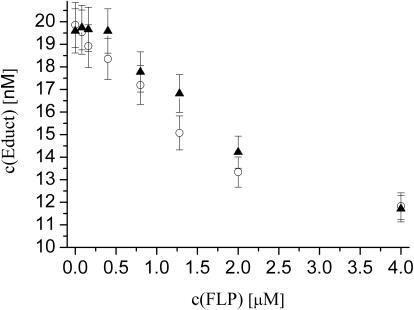
Figure 4.
Equilibrium substrate concentrations depend on the amount of FLP used and on buffer composition. The equilibrium concentration is equal to the concentration of remaining double-labeled molecules after recombination/proteinase K digestion and was obtained from DC-FCCS measurements according to Equation 2. Standard 5% error bars are shown. The concentration of FLP is plotted on the x-axis. Filled triangles, without BSA; Open circles, with 100 μg/ml BSA.

