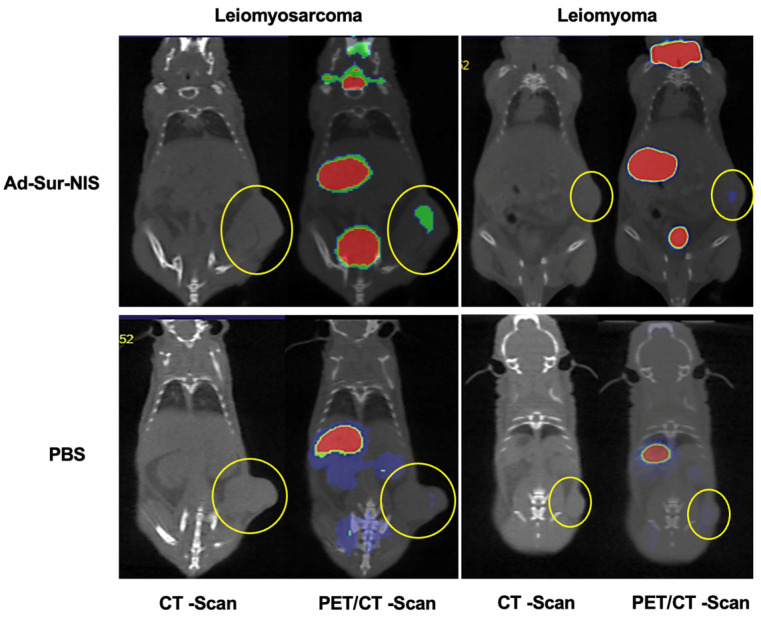
Figure 4.
PET/CT images of Ad-Sur-NIS treated mice and control mice (treated with PBS). The PET/CT scans were performed 45 minutes after the F18-NaBF4 administration. The tumors are identified in CT images as indicated by the yellow circles. The uptake intensities of F18-NaBF4 are “rainbow” color-coded from red (high intensity) to green (medium intensity) to blue (low intensity). While large amounts of F18-NaBF4 are presented in the bladder, stomach, and thyroid as intrinsic uptake/distribution, the uptake of F18-NaBF4 in LMS is clearly visualized (green color), while the uptake of F18-NaBF4 in LM is minimal. Control experiments with mice treated with PBS (instead of Ad-Sur-NIS) indicated no uptake of F18-NaBF4 in both LMS and LM. The results indicated that the F18-NaBF4 PET/CT scan is capable of differentiating malignant LMS from benign LM.

