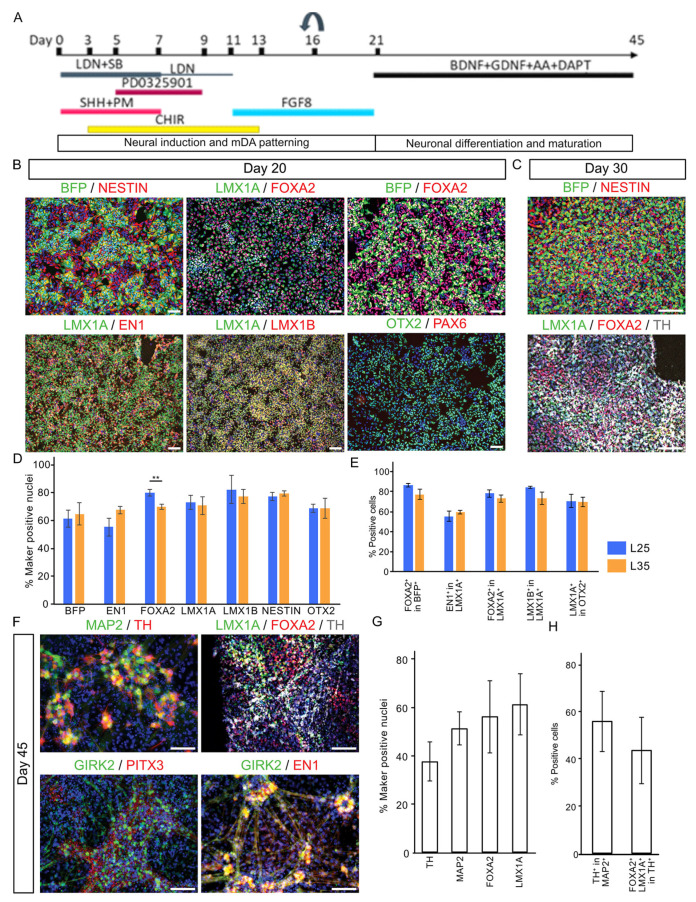
Figure 2.
Immunocytochemical characterization of mDA cultures. (A) Illustrations of mDA differentiation protocol. (B) Shown are representative day 20 cultures stained for antibodies against BFP, NESTIN, LMX1A, FOXA2, EN1, LMX1B, OTX2, and PAX6. (C) Day 30 cultures immunostained for BFP, NESTIN, LMX1A, FOXA2, and TH. (D,E) Bar graph showing quantitative representation of the above, data are presented as mean ± SD of three independent differentiation. Student’s t-test was employed for comparison between A17L25 and A17L35 for each measurement. None but FOXA2 was significantly different between the two lines (p = 0.009, **). (F) Day 45 cultures immunostained for LMX1A, FOXA2, EN1, GIRK2, MAP2, PITX3, and TH. (G,H) Bar graph showing quantification of day 45 immunostaining. Scale bar 100 μM.

