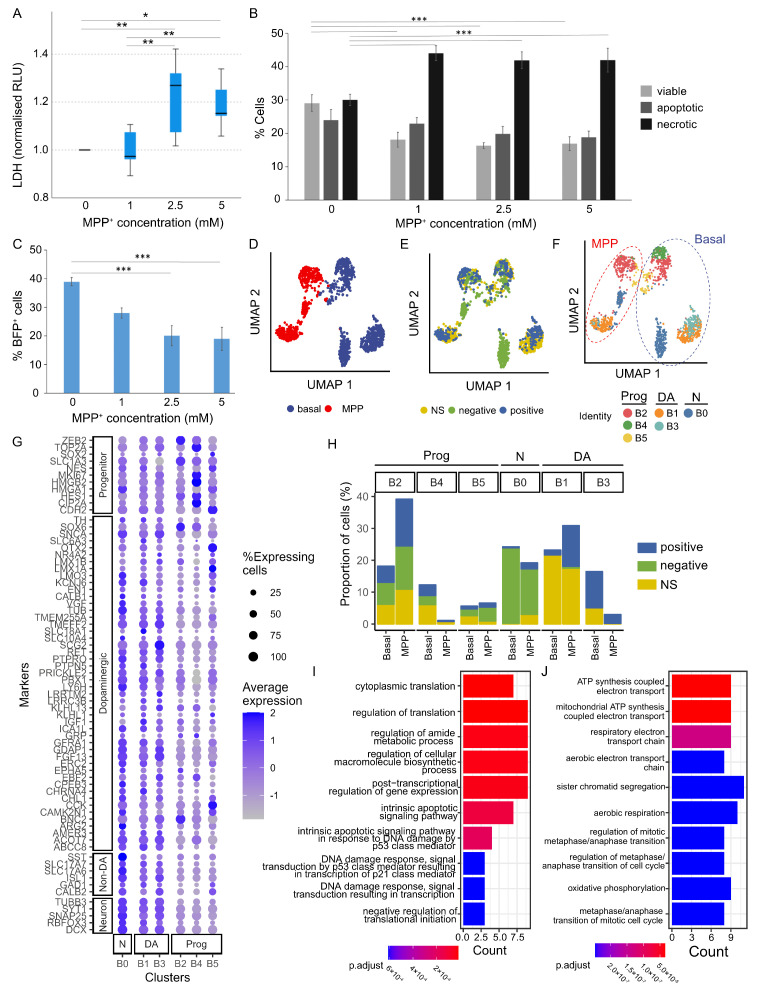
Figure 5.
Modelling PD-related toxicity using MPP+. (A) Quantification of MPP+ cytotoxicity by LDH assay. Kruskal–Wallis H Test, p = 0.003, Pairwise comparisons: 0 mM vs. 1 mM, p = 0.797, 0 mM vs. 2.5 mM, p = 0.008, 0 mM vs. 5 mM, p = 0.020, 1 mM vs. 2.5 mM, p = 0.004, 1 mM vs. 5 mM, p = 0.010, 2.5 mM vs. 5 mM, p = 0.838. (B) Quantification of viable, apoptotic, and necrotic cells determined by Annexin V assay. ANOVA, p = 0.001 for viable cells; p = 0.009 for necrotic fraction. (C) Increasing doses of MPP+ led to progressive decrease in BFP+ cells. ANOVA, p = 0.001. Data shown in (A–C) represents mean ± s.e.m. from 3 biological replicates each with 3 technical replicates per condition of two independent cell lines. * p ≤ 0.05, ** p ≤ 0.01, *** p ≤ 0.001. (D) UMAP plot showing strong segregation of untreated (basal) and MPP+ treated cells (a total of 1418 cells). (E) UMAP plot including basal and MPP+ treated cells colored by sorted status (BFP+, BFP− and NS). (F) UMAP plot colored by clusters identified for the basal cells (B0 to B5) and predicted clusters of MPP+ treated cells using the basal cell profile as reference. (G) Dot plot showing the expression of marker genes in different clusters of both basal and MPP+-treated cells. (H) Bar graph showing the distribution and portion of cells in each of the 6 clusters, which are presented separated by the sorting status. (I,J) Top 10 gene ontologies (GO) enriched in the DEGs upregulated (I) and downregulated (J) in MPP+ treated B3 population compared to basal B3 population.

