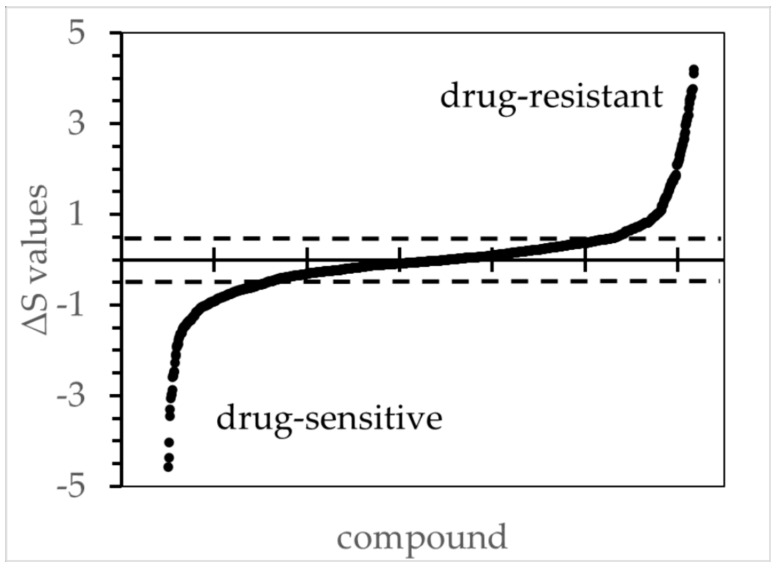
Figure 1.
The ΔS values for all tested compounds comparing ipNF95.6 against the reference cell line ipnNF95.11C. The figure illustrates the order of ΔS values from low to high based on concentration/response curves, wherein the R2 values were ≥ 0.8. The ΔS thresholds 0.5 and −0.5 are marked with a dotted line, and values beyond those were deemed to be biologically significant during the subsequent candidate selection. Other PNF1 cell lines had similar distributions (not shown).

