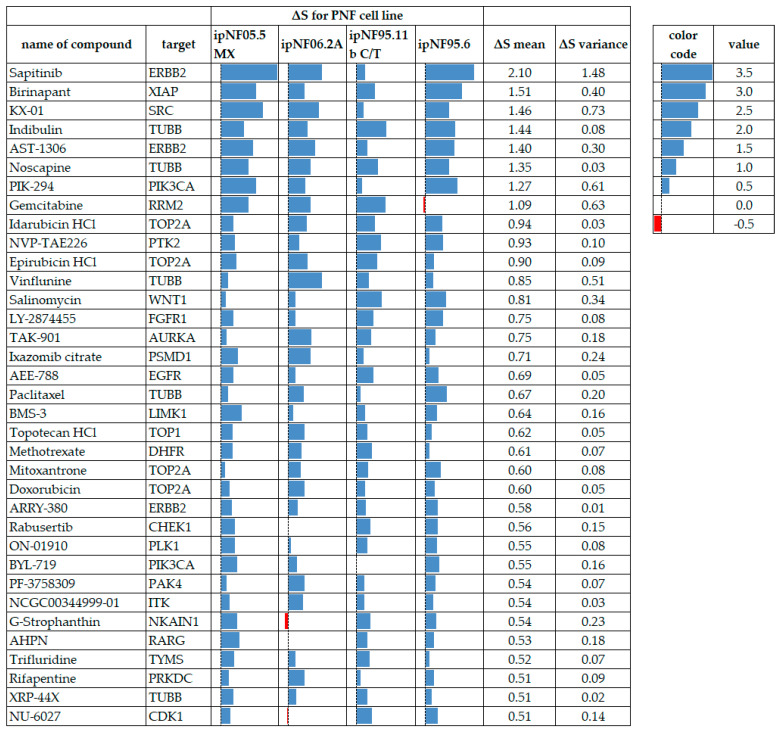
Figure 6.
PNF1 tumor cell lines displaying drug-resistance to test compounds meeting the ΔS mean threshold and variance criteria, where all cell lines had data. Blue data bars indicate the ΔS for each cell line with higher values (more resistance) to the right in each cell. Red bars indicate drug sensitivity. ΔS mean values are arranged from the most resistant at the top to the least resistant at the bottom. A red color indicates compound sensitivity, and blue indicates compound resistance.

