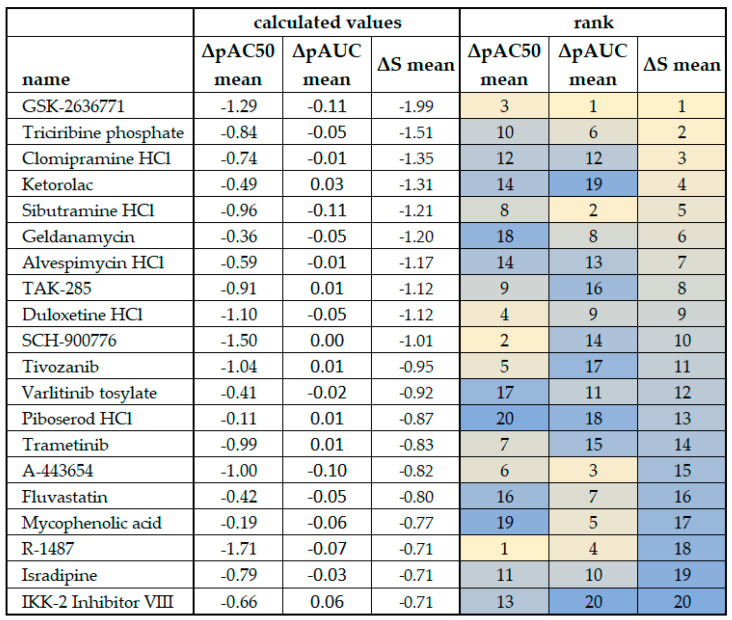
Figure 7.
Comparison of ΔpAC50 mean, ΔpAUC mean, and ΔS mean scores from plexiform neurofibroma cell lines. The cell line ipnNF9511.C derived from the non-tumor nerve was used as the reference in the calculations. Outcomes for ΔS mean (see Figure 5) are ranked and color-coded to facilitate comparison, and the rank is compared to that derived from the ΔpAC50 mean and ΔpAUC mean. Bright yellow indicates the top ranking for each column/calculation method and dark blue indicates the bottom ranking.

