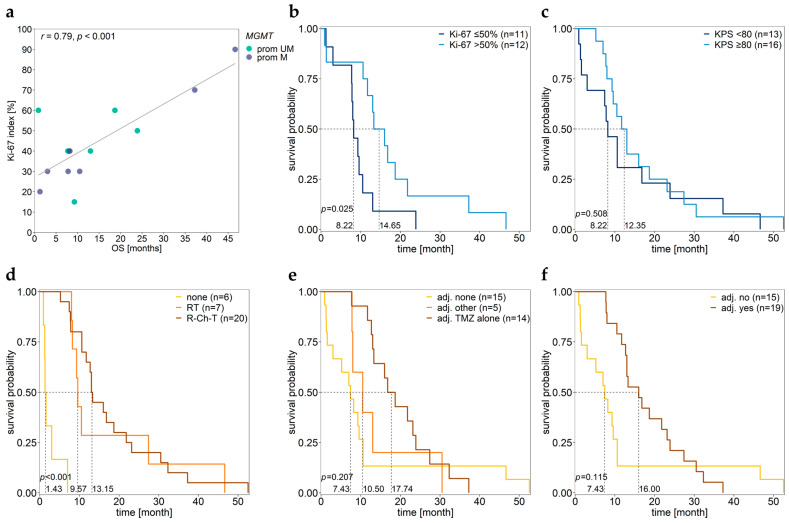
Figure 6.
Association of Ki-67 index, KPS, and therapy with OS. Scatterplot showing the (a) correlation between Ki-67 index and OS in patients independent of their MGMT promoter methylation status. (b–f) Kaplan–Meier survival analysis of samples grouped by (b) Ki-67 index, (c) KPS, (d) primary therapy, and (e,f) adjuvant therapy status. Patient GBM27 was excluded due to a lack of OS data. Prom M—promoter methylated (purple), UM—unmethylated (green), UM + M (gray) samples.

