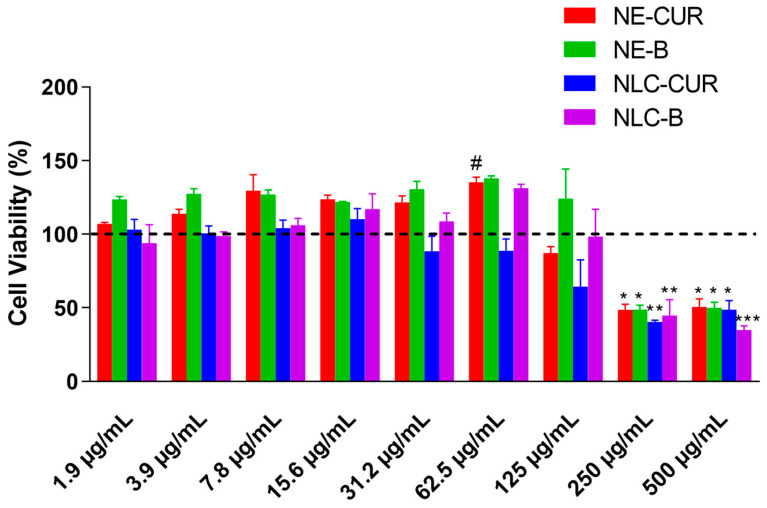
Figure 4.
Effects of NE-CUR, NE-B, NLC-CUR, and NLC-B on cellular viability of HFF-1 cells. Each bar represents the mean +/− SEM (standard error of mean) of percentage of cell viability. Control (untreated cells) is represented by the dotted line. The experiments were performed in duplicate. Statistical analysis was performed using one-way ANOVA followed by Bonferroni’s multiple comparisons test. * p < 0.05; ** p < 0.01; *** p < 0.001 represent the difference from control (dotted line). # p < 0.05 represent the difference from NLC-CUR.

