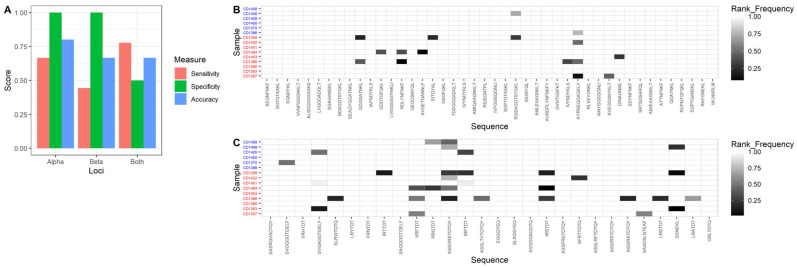
Figure 4.
Cohort 2: testing dataset. (A) Sensitivity, specificity, and accuracy for TCR-α, TCR-β, and both TCR-α and TCR-β combined for cohort 2, testing dataset. Optimal threshold and coeliac-predictive sequences determined using the training dataset were used. (B) Heatmap showing ranked-frequency for the sequences included in the TCR-α model, and (C) heatmap showing ranked-frequency for the sequences included in the TCR-β model. Red labels indicate patients with CeD, blue labels indicate controls. Light colours represent absence of the sequence in that individual, whilst dark colours represent the presence of the sequence at high ranked-frequency.

