
FIGURE 3.
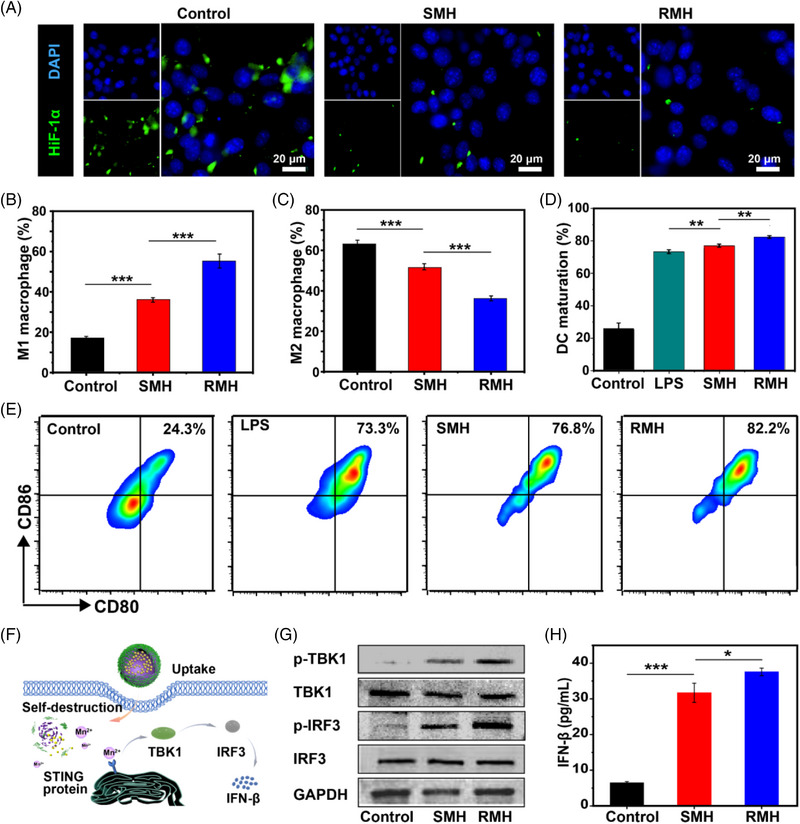
Immunomodulatory effects of RMH and SMH by alleviating hypoxia. (A) Immunofluorescence analysis of HIF‐1α expression of 4T1 cells after different treatments. Flow cytometric analysis of (B) M1 macrophages (CD11b+CD86+) and (C) M2 macrophages (CD11b+CD206+) after incubation with RM and SM (Mean ± SD, n = 3). (D) Flow cytometric analysis and (E) quantification of CD80 and CD86 expression on BMDCs (gated on CD11c+ DCs) after different treatments (Mean ± SD, n = 3). (F) Schematic illustration of nanoparticles‐mediated activation of the STING pathway. (G) Western blot assay of p‐TBK1, TBK1, p‐IRF3, and IRF3 expression in the BMDCs after different treatments. (H) Secretion of IFN‐β secreted in BMDC suspensions after the incubation with SMH and RMH (Mean ± SD, n = 3). *p < 0.05, **p < 0.01, ***p < 0.001, analyzed by one‐way ANOVA with Tukey's test.