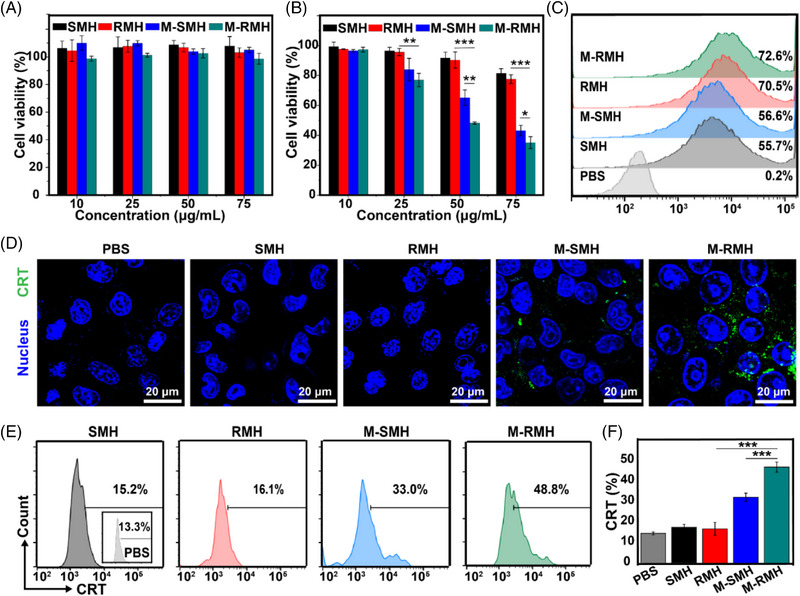
FIGURE 4.

Cell viability of (A) HEK293 cells and (B) 4T1 cells after different treatments (Mean ± SD, n = 4). (C) Flow cytometric analysis of 4T1 cells treated with FITC‐labeled SMH, RMH, M‐SMH, and M‐RMH for 4 h. (D) CLSM images of CRT expression on the surface of 4T1 cells after different treatments. (E) Flow cytometric analysis and (F) quantification of CRT expression on the surface of 4T1 cells after various treatments (Mean ± SD, n = 3). *p < 0.05, **p < 0.01, ***p < 0.001, analyzed by one‐way ANOVA with Tukey's test.
