
FIGURE 5.
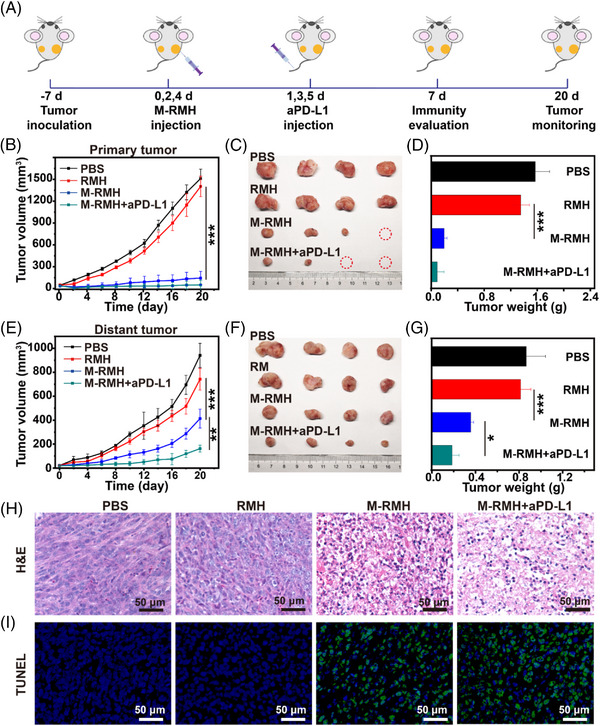
In vivo antitumor efficacy of M‐RMH on a bilateral tumor‐bearing mice model. (A) Schematic illustration of experimental design in vivo. (B) Tumor growth curves, (C) representative photographs, and (D) average tumor weights of primary tumors in mice after the treatment with PBS, RMH, M‐RMH, and M‐RMH + aPDL1, respectively (Mean ± SD, n = 4). (E) Tumor growth curves, (F) representative photographs, and (G) average tumor weights of distant tumors of mice after different treatments (Mean ± SD, n = 4). (H) H&E and (I) TUNEL staining of primary tumors after different treatments. *p < 0.05, **p < 0.01, ***p < 0.001, analyzed by one‐way ANOVA with Tukey's test.