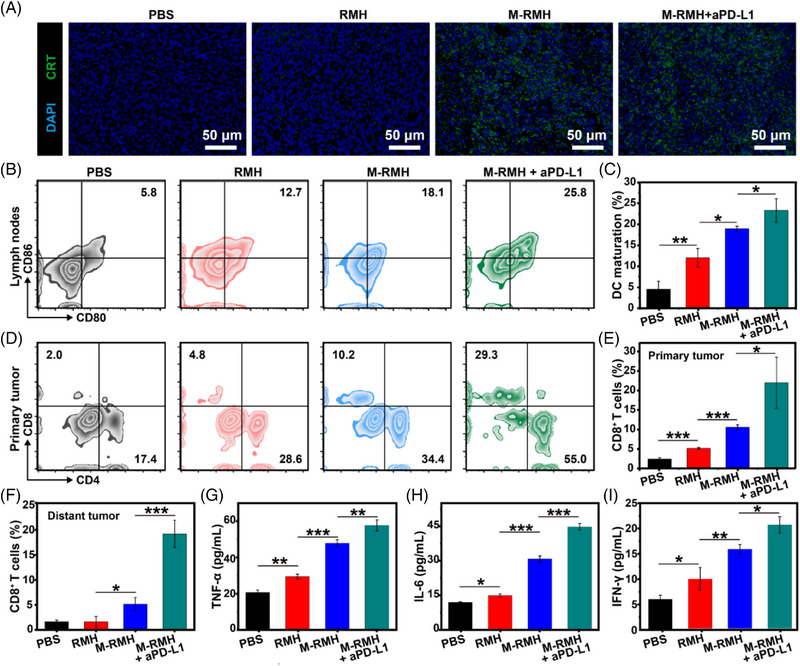
FIGURE 6.

Immune responses elicited by M‐RMH on a bilateral tumor‐bearing mice model. (A) Immunofluorescence images of tumor sections after CRT staining after different treatments. (B) Representative flow cytometry analysis and (C) quantification of matured DC (CD80+CD86+, gated on CD11c+ DCs) in lymph nodes after different treatments (Mean ± SD, n = 3). (D) Representative flow cytometry analysis of CD4+ and CD8+ T cells (gated on CD3+ T cells) in the primary tumors after various treatments. (E) Quantification of CD8+ T cells in the primary tumors after various treatments (Mean ± SD, n = 3). (F) Quantification analysis of CD8+ T cells in distant tumors after different treatments (Mean ± SD, n = 3). Cytokine levels of (G) TNF‐α, (H) IL‐6, and (I) IFN‐γ in the serum of mice after various treatments (Mean ± SD, n = 3). *p < 0.05, **p < 0.01,***p < 0.001, analyzed by one‐way ANOVA with Tukey's test.
