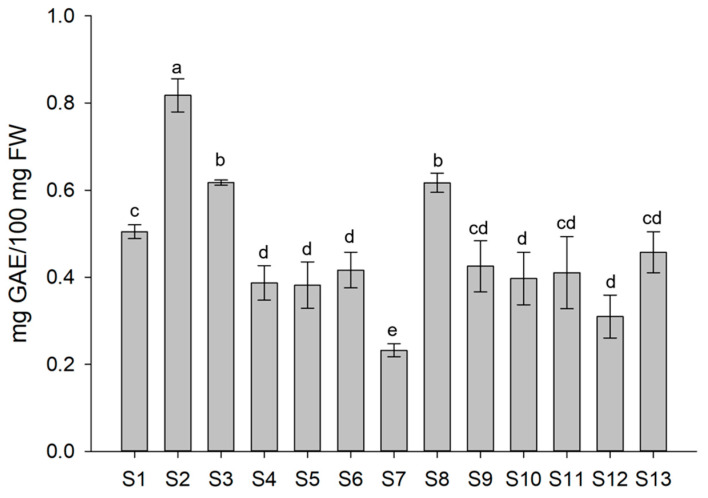
Figure 5.
Total phenolic content (TPC) of lettuce plants subjected to the different treatments, expressed as gallic acid equivalents (GAEs) and measured using the Folin–Ciocalteu colorimetric assay. Each value represents the mean ± SD of five biological replicates. Different letters are significantly different between treatments at p < 0.05 by analysis of variance (ANOVA).

