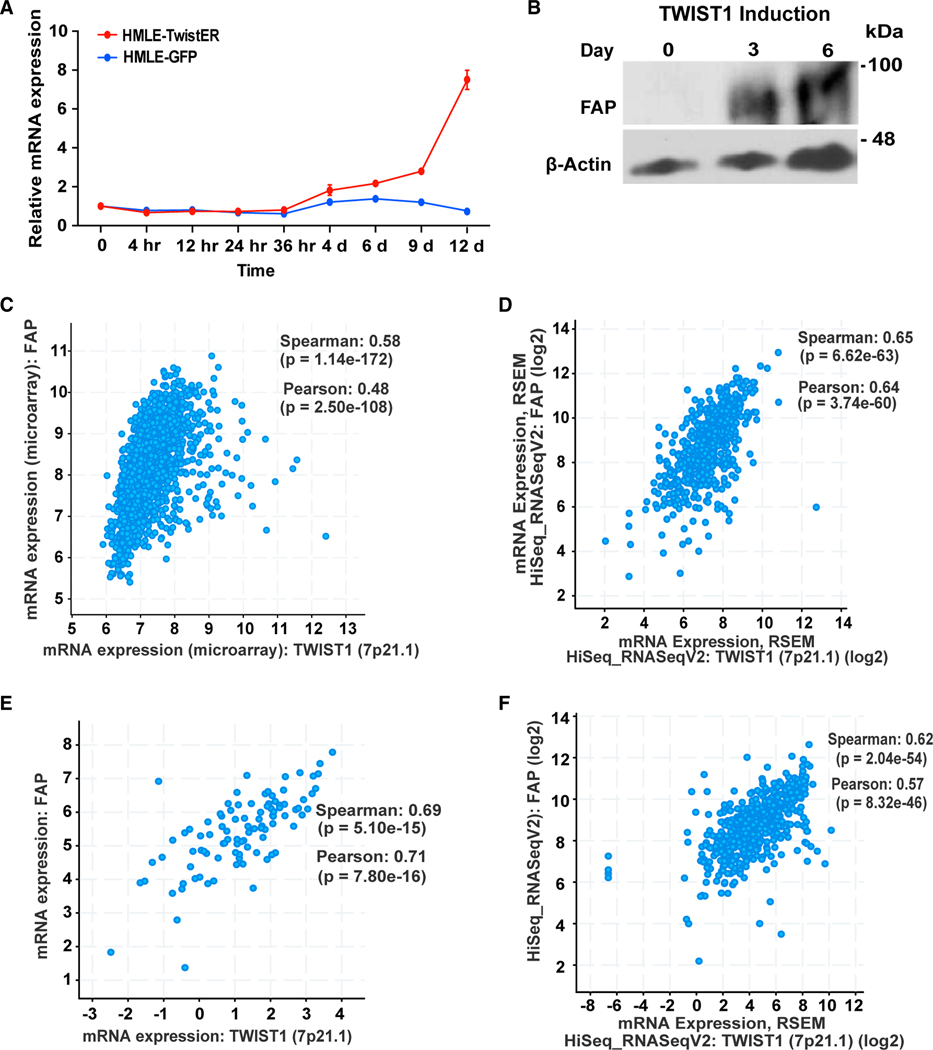
Figure 1. Expression of TWIST1 and FAP is tightly correlated in various human cancer types.
(A) qRT-PCR measured FAP mRNA levels in HMLE-TwistER cells undergoing Twist1 induction (red), and in un-induced HMLE-GFP cells (blue). Error bars represent the SEM.
(B–F) (B) Lysates from HMLE-TwistER induced cells probed for FAP and β-actin over the course of 6 days. The Cancer Genome Atlas (TCGA) data showing correlation between Twist1 and FAP in human breast cancer (C), head and neck cancer (D), lung cancer (E), and pancreatic cancer (F). Expression data were retrieved from cBioPortal. Both Spearman correlation coefficients with p values and Pearson correlation coefficients with p values are presented.

