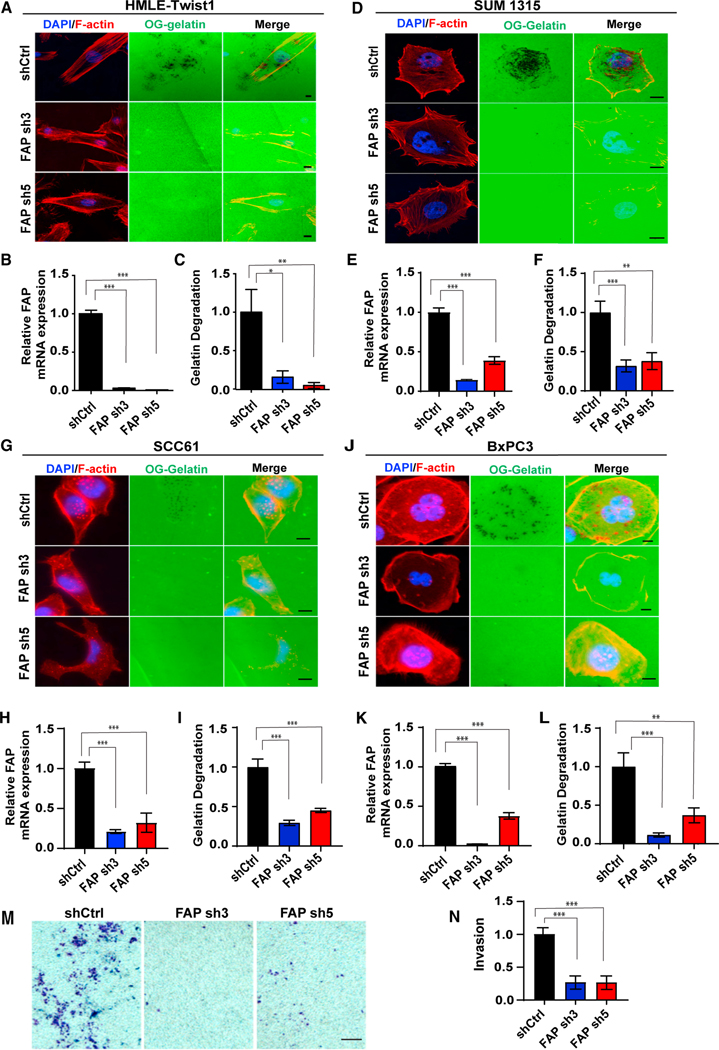
Figure 3. FAP is required for invadopodia-mediated ECM degradation.
(A–L) OG gelatin degradation assay was performed on HMLE-TWIST1 cells expressing FAP shRNAs (A–C) plated for 16 h; SUM1315 cells expressing FAP shRNAs (D–F) were plated for 6 h; SCC61 cells expressing FAP shRNAs (G–I) were plated for 16 h; and BxPC3 cells expressing FAP shRNAs were plated for 8 h (J– L). FAP gene knockdown levels are measured by qRT-PCR (B, E, H, and K). F-actin was stained with phalloidin (red) and nuclei with DAPI (blue). Areas of degradation appear as punctate black areas beneath the cells.
(M) SCC61 cells expressing FAP shRNAs were plated on Matrigel-coated transwell chambers. Cells that invaded through the Matrigel were stained using crystal violet.
(N) Quantification of invasion normalized over cells expressing a control shRNA. Error bars in (B, E, H, and K) represent the SD. Error bars in (C, F, I, and L) represent the SEM. ***p < .001, **p < .01, *p < .05, Student’s t-test. Scale bars in (A, D, G, and J), 10 μm; scale bar in (M), 100 μm. See also Figure S2.

