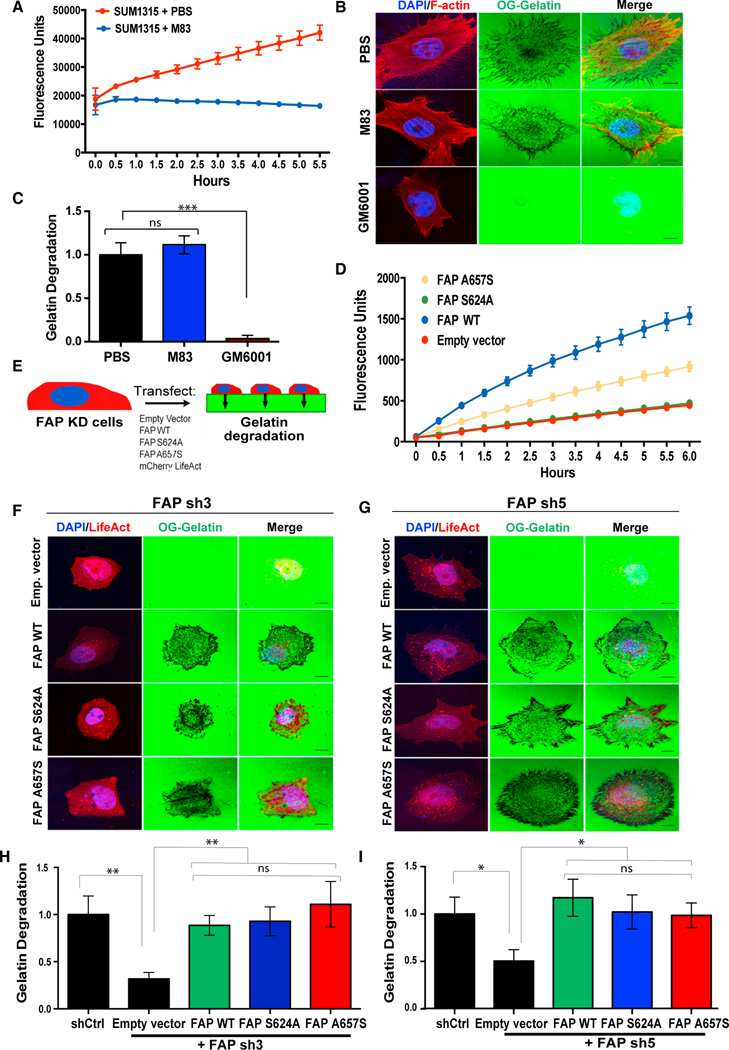
Figure 4. FAP promotes ECM degradation independent of its proteolytic activity.
(A) SUM1315 cells, seeded at 80%–90% confluency in a 96-well plate, were treated with PBS or 10 μM of the FAP inhibitor, M83, followed by 125 μM of the FAP-specific substrate, C95. FAP-mediated C95 cleavage fluorescence was measured over time.
(B) SUM1315 cells were seeded onto OG-labeled gelatin in the presence of PBS, M83, or GM6001 for 6 h and subsequently stained for F-actin (red) and nuclei (blue).
(C) Quantification of degradation of OG labeled gelatin by SUM1315 cells from (B).
(D) FAP-mediated C95 cleavage was measured in 293T cells expressing catalytically inactive FAP mutants.
(E) SUM1315 cells with FAP knockdown were transfected with the indicated constructs, seeded onto OG-labeled gelatin, and evaluated for ECM degradation relative to SUM1315 cells expressing a control shRNA.
(F) SUM1315 cells expressing FAP sh3 and transfected with the constructs indicated in (E) were seeded onto OG-labeled gelatin for 6 h. (H) Quantification of OG gelatin degradation from (F).
(G) SUM1315 cells expressing FAP sh5 and transfected with the constructs indicated in (E) were seeded onto OG-labeled gelatin for 6 h.
(I) Quantification of OG gelatin degradation from (G). Error bars in (A and D) represent the SD. Error bars in (C, H, and I) represent the SEM. ***p < .001, **p < .01, *p < 0.05. ns, not significant (p > 0.5), Student’s t-test. N = 150 cells per group. Scale bar, 10 μm. See also Figure S3.

