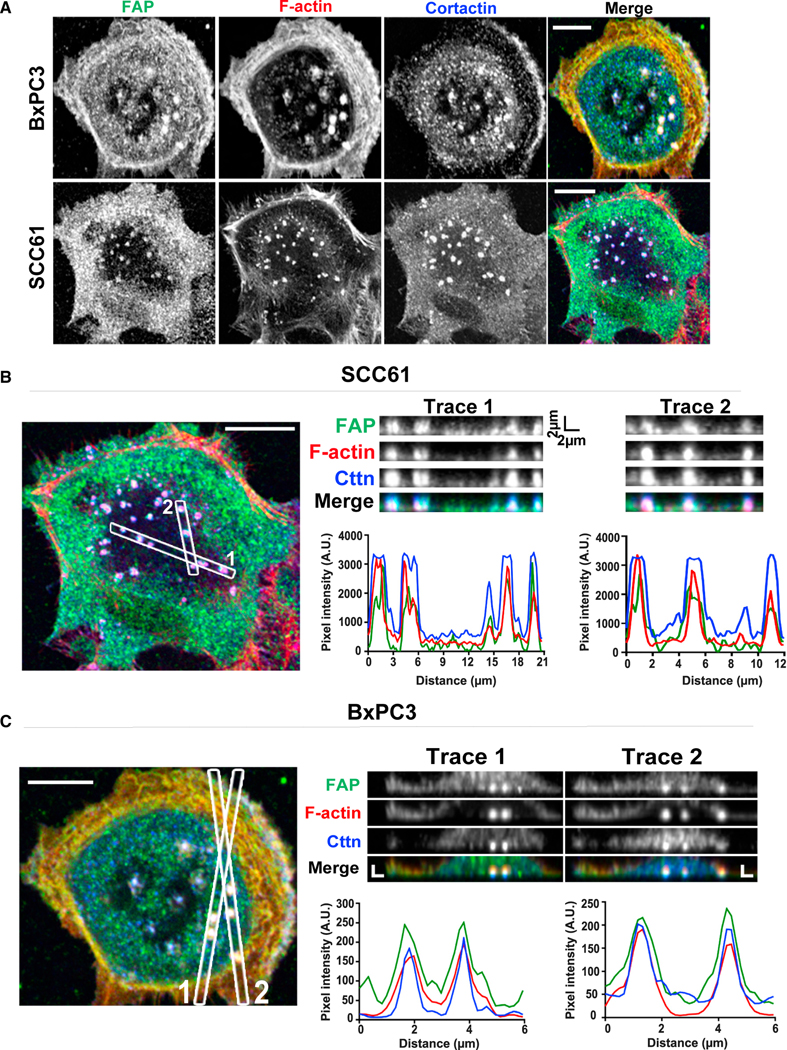
Figure 5. FAP localizes at invadopodia in various human cancer cells.

(A–C) (A) BxPC3 and SCC61 cells were seeded onto gelatin-coated coverslips for 48 h and labeled for FAP (green), F-actin (red), and cortactin (blue). Confocal image of SCC61 (B) and BxPC3 (C). Traces 1 and 2 are z axis sectioning of invadopodia in each cell line; associated graphs represent pixel intensities along the dotted lines to show the colocalization of FAP, F-actin, and cortactin. Scale bar, 10 μm. See also Figure S4.
