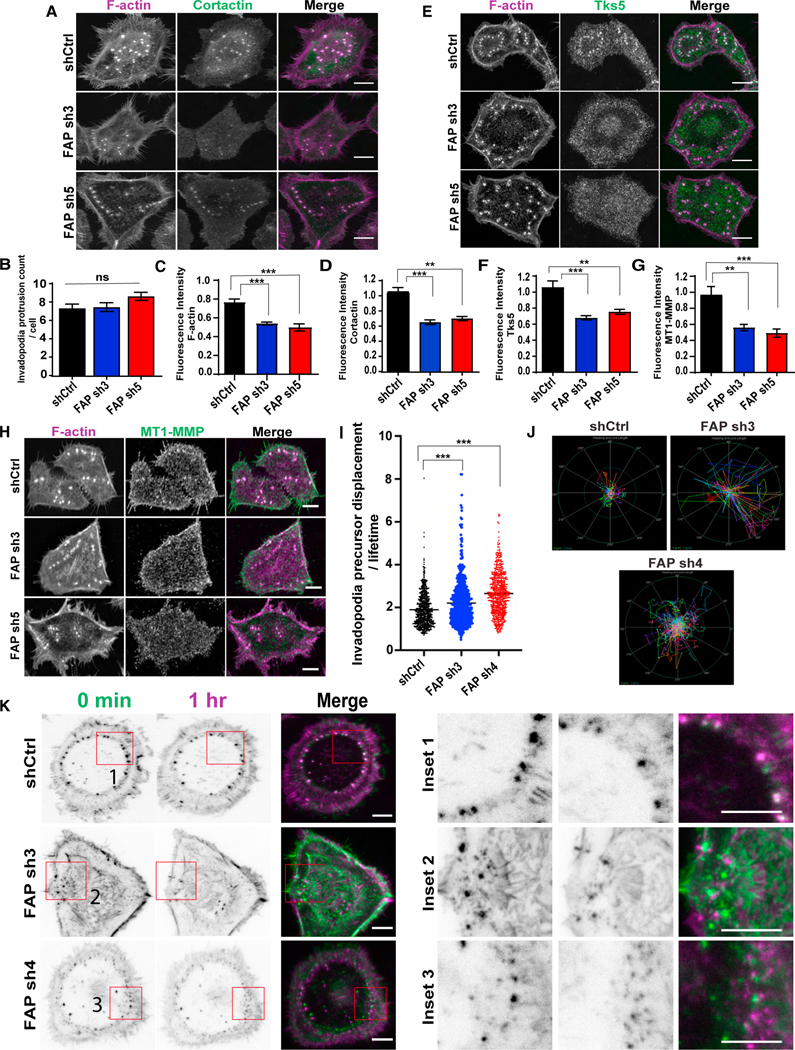
Figure 6. FAP knockdown blocks invadopodia precursor stabilization and subsequent maturation.

(A, D, E, H, F, G) SCC61 cells expressing the indicated FAP shRNAs were seeded onto gelatin-coated coverslips for 48 h, and stained for F-actin (magenta), and cortactin (green) (A), Tks5 (green) (E), MT1-MMP (green) (H). N = >20 cells per group. Scale bar, 10 μm. Quantification of normalized fluorescence intensity of cortactin (D), Tks5 (F), and MT1-MMP (G) at invadopodia relative to control shRNA.
(B) Quantification of invadopodia protrusion count per cell in SCC61 cells expressing FAP shRNAs.
(C) Quantification of F-actin intensity in SCC61 cells expressing different FAP shRNAs.
(I) Quantification of average invadopodia protrusion displacement divided by its lifetime (number of frames) (pixels/min) in Life-Act mCherry expressing SCC61 cells with FAP shRNAs. Each dot in the graph represents individual precursors. N > 100 precursors per group.
(J) Polar graph indicating invadopodia precursor trajectories in a representative SCC61 cell expressing shRNAs targeting FAP. The outer ring (green) represents the distance of 4 μm and inner circle (blue) represents distance of 2 μm. Tracks were measured at 20 s/frame for 30 min.
(K) Time lapse pictures of live SCC61 cells expressing F-actin and FAP shRNAs captured using TIRF microscopy at 100× magnification at time 0 (green) and at 1 h (magenta). Insets show zoomed in view of invadopodia displacement over time. Scale bar, 10 μm. Error bars are the SEM. ***p < .001, **p < .01, *p < .05. ns, not significant (p > 0.5). Student’s t-test. See also Figure S4A and Videos S1−S3.
