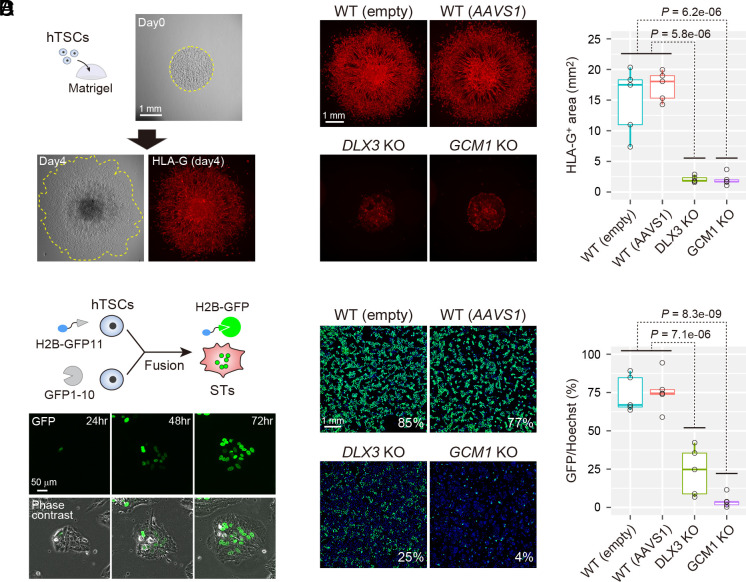
Fig. 2.
Functional analysis of DLX3 and GCM1 in hTSCs. (A) Quantification of EVT differentiation potential. Undifferentiated hTSCs were embedded in Matrigel drops and subjected to EVT differentiation. An anti-HLA-G antibody was used to detect EVTs. (B) EVT differentiation potentials of DLX3 KO and GCM1 KO clones. WT clones containing either an empty sgRNA vector or an AAVS1-targeting sgRNA vector were used as controls. We measured the HLA-G-positive area (red) to quantify the EVT differentiation potentials. Five independent clones were analyzed for each genotype. P-values were calculated using the Student’s t test. (C) Quantification of cell fusion efficiency. GFP11-labeled histone H2B was transfected into one pool of hTSCs, and GFP1-10 was transfected into another. These hTSC pools were mixed and subjected to ST differentiation. (D) ST differentiation potentials of DLX3 KO and GCM1 KO clones. We quantified the fusion efficiency by dividing the GFP-labeled area (green) by the Hoechst-labeled area (blue). Five independent clones were analyzed for each genotype. P-values were calculated using the Student’s t test.

