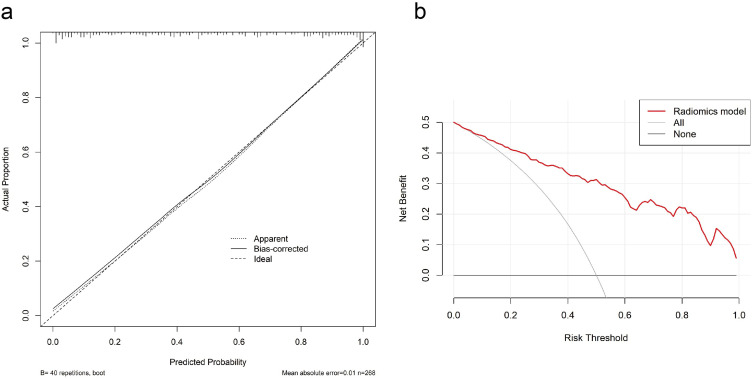
Figure 5.
The assessment of the model calibration curve and decision curve analysis (DCA) in the primary cohort. (a) Calibration curve: The ideal line was the standard curve, and the bias-corrected line was the calibrated predicted curve. The closer the calibration curve was to the ideal curve, the better the predictive ability of the model was. (b) Decision curve analysis (DCA): Net benefit of intervention according to radiomics model.

