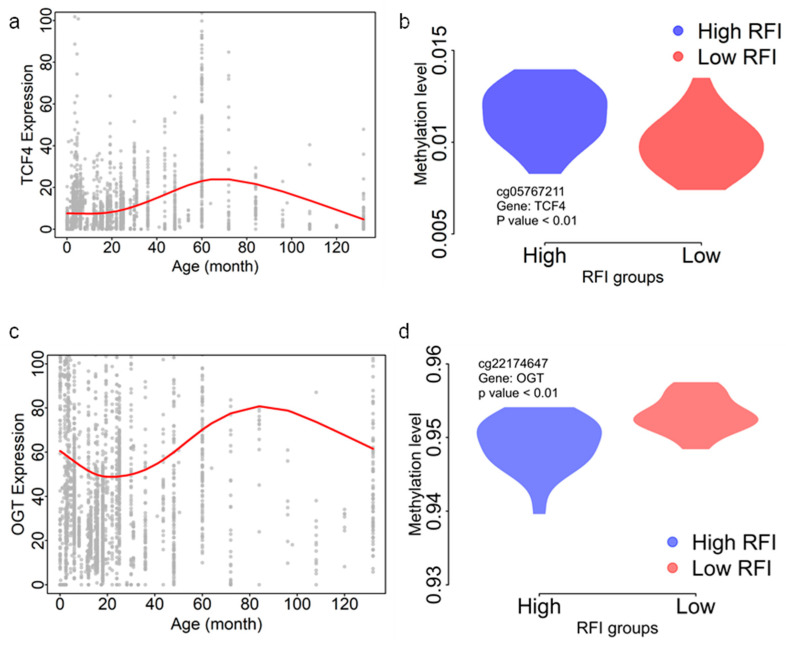
Figure 3.
CpG gene expression throughout aging. (a) TCF4 expression with cattle age increase. (b) Comparison between methylation levels of cg05767211 between low- and high-RFI groups. (c) CGT expression with cattle age increase. (d) Comparison between methylation levels of cg22174647 between low- and high-RFI groups. The red curves in (a,c) were modeled using the smooth.spline function in the R package for age and gene expression.

