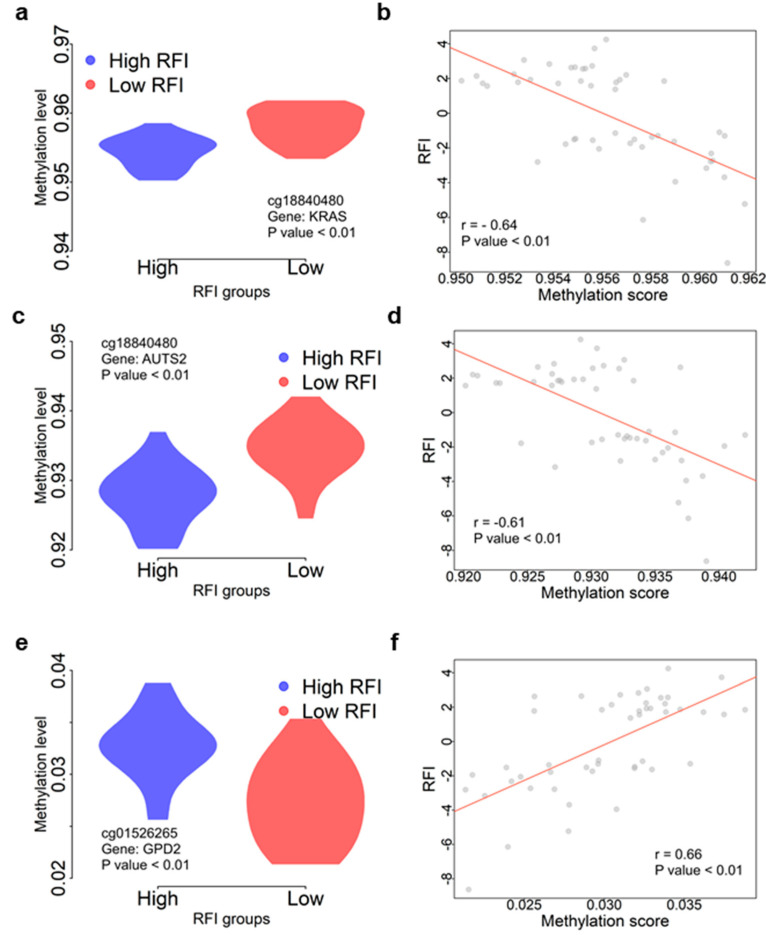
Figure 4.
Functional annotation for FE genes. (a) The comparison between methylation levels of cg18840480 between low- and high-RFI groups. The corresponding gene (KRAS) of cg18840480 was annotated on the panel. (b) The correlation between methylation scores and RFI using 48 individuals for cg18840480. (c) The comparison between methylation level of cg14397160 between low- and high-RFI groups. The corresponding gene (AUTS2) of cg14397160 was annotated on the panel. (d) The correlation between methylation scores and RFI using 48 individuals for cg14397160. (e) The comparison between methylation levels of cg01526265 between low- and high-RFI groups. The corresponding gene (GPD2) of cg01526265 was annotated on the panel. (f) The correlation between methylation scores and RFI using 48 individuals for cg01526265. The red lines in (b,d,f) were regressions between two corresponding variables.

