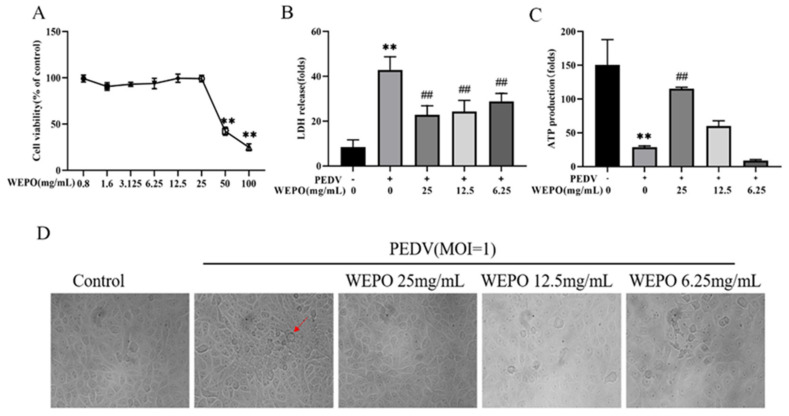
Figure 2.
WEPO attenuated PEDV-infected Vero cell injury. (A) The cytotoxicity of WEPO on Vero cells. Vero cells were treated with different concentrations of WEPO for 24 h, and the cell survival rate was detected using a CCK-8 assay. The data are expressed as the means ± SD (n = 8). ** p < 0.01 vs. control. (B) After PEDV infects Vero cells, different concentrations of WEPO were used to detect the release of LDH. The data are expressed as the means ± SD (n = 3). ** p < 0.01 vs. control. ## p < 0.01 vs. positive control (PEDV). (C) PEDV-infected Vero cells were treated with different concentrations of WEPO to detect the amount of ATP production. The data are expressed as the means ± SD (n = 3). ** p < 0.01 vs. control. ## p < 0.01 vs. positive control (PEDV). (D) PEDV-infected Vero cells were treated with different concentrations of WEPO, and cell morphology was observed. (The magnification of a microscope is 200 times. The area indicated by the red arrow is the vacuole formed after Vero cell lesion).

