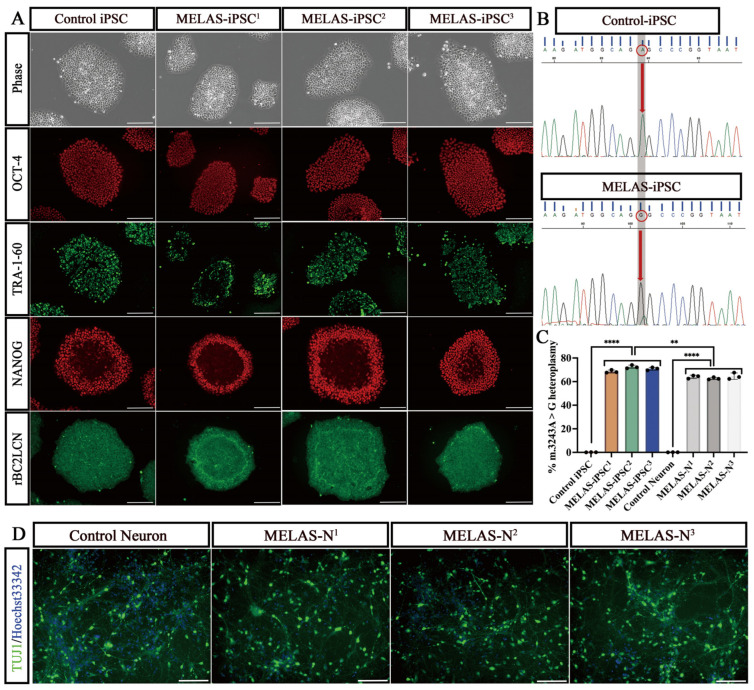
Figure 1.
Heteroplasmy of iPSC-induced neurons. (A) Immunostaining of pluripotency and surface markers (OCT4, TRA-1-60, NANOG, and rBC2LCN) in representative iPSCs (Control-iPSC, MELAS-iPSC1, MELAS-iPSC2, and MELAS-iPSC3). Scale bars, 400 μm. (B) Sequencing chromatogram showing the heteroplasmic m.3243A>G mutation in iPSCs from patients with MELAS. Red circles represent adenine (A)-guanine (G) transitions on mtDNA 3243 nucleotides. (C) Quantification of the percentage of m.3243A>G heteroplasmy in iPSCs and their induced neurons in each group (n = 3). (D) Immunostaining for the surface marker TUJ1 in representative neurons (control neurons, MELAS-N1, MELAS-N2, and MELAS-N3). Scale bars, 100 μm. Data represent the mean ± standard deviation (SD) of three independent experiments. ** p < 0.01, **** p < 0.0001.

