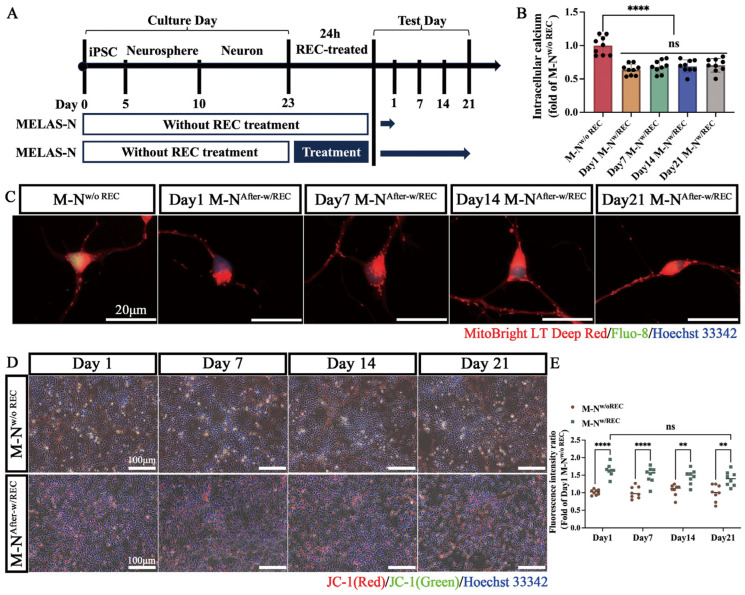
Figure 8.
Persistency of REC functional mitochondria. (A) Schematic representation of the experiment used to assess the duration of REC mitochondrial function. (B) Intracellular calcium levels were quantified in MELAS neurons (MELAS-N) grown on days 1, 7, 14, and 21 (after receiving REC-donated mitochondria) and in MELAS neurons with high heteroplasmy (n = 9). (C) Representative fluorescence microscopy images of fluo-8 staining in each group of MELAS neurons on days 1, 7, 14, and 21. (D) Representative images of MELAS and REC-treated MELAS neurons stained with JC-1 on days 1, 7, 14, and 21. (E) Quantification of JC-1 fluorescence intensity ratios in REC-treated and untreated MELAS neurons (n = 8). (F) Expression levels of GDF-15 in different groups of neuronal culture media (n = 7). (G) GDF-15 levels were quantified in MELAS neurons grown on days 1, 7, 14, and 21 (after receiving REC-donated mitochondria) and in MELAS neurons with high heteroplasmy (n = 7). (H) Seahorse XFp metabolic flux analysis of mitochondrial ATP production rates and glycolytic ATP production rates in each group of MELAS neurons (n = 8). (I) XFp ATP rate index calculated from data in panel H (n = 8). Data represent the mean ± standard deviation (SD) of three independent experiments. ns, not significant. ** p < 0.01; **** p < 0.0001.


