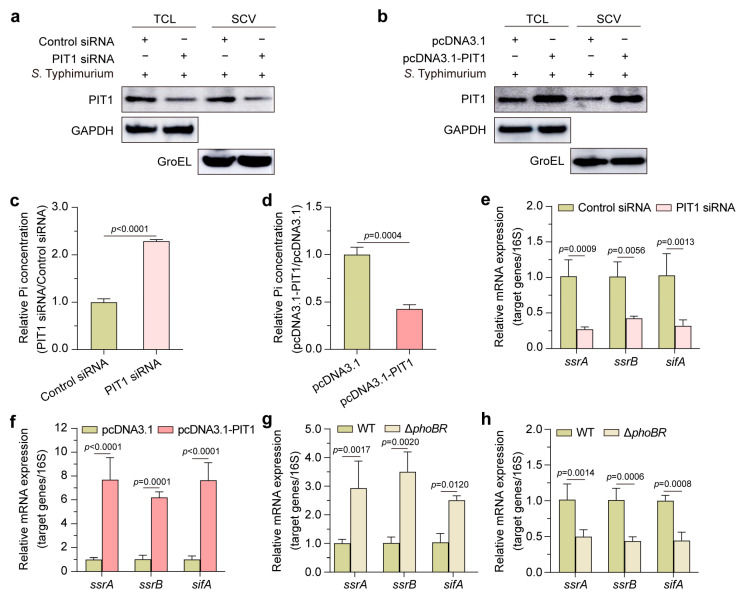
Figure 3.
PIT1 transports Pi into cytosol and regulates SPI-2 genes via PhoBR. (a,b) Western blotting analysis to show the expression of PIT1 in TCL and SCVs from PIT1 siRNA (a) or pcDNA3.1-PIT1 (b) transfected cells. (c,d) The relative Pi concentrations in SCVs were determined with fluorimetric phosphate assay kit. The bar graphs show the Pi concentration in SCVs transfected with PIT1 siRNA (c) or pcDNA3.1-PIT1 (d) relative to those of control. (e) qRT-PCR analysis of the relative mRNA expression of ssrA, ssrB, and sifA from S. Typhimurium at 2 h p.i. in control siRNA- or PIT1 siRNA-transfected cells. (f) qRT-PCR analysis of the relative mRNA expression of ssrA, ssrB, and sifA from S. Typhimurium at 2 h p.i. in pcDNA3.1- or pcDNA3.1-PIT1-transfected cells. (g,h) qRT-PCR analysis of the relative mRNA expression of ssrA, ssrB, and sifA from wild-type strain (WT) or ΔphoBR mutant at 2 h p.i. in PIT1 siRNA (g) or pcDNA3.1-PIT1 (h) transfected cells. Data indicate means ± SD (n = 3). The significant differences are represented by p-values determined with Student’s t test (c,d) or two-way ANOVA (e–h).

