Figure 4.
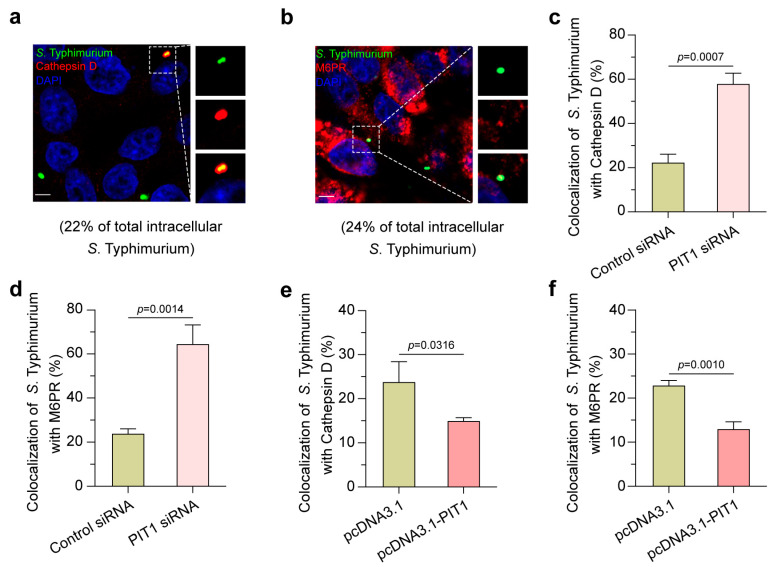
Upregulated PIT1 prevents the fusion of SCVs with lysosomes. (a,b) Immunofluorescence assays to show colocalization of S. Typhimurium with Cathepsin D (a) and M6PR (b). Scale bar = 5 μm. The number indicates the percentage of SCVs colocalized with PIT1 relative to total intracellular SCVs. (c,d) The bar graphs show the percentage of S. Typhimurium localized with Cathepsin D (c) and M6PR (d) in control siRNA- or PIT1 siRNA-transfected cells. (e,f) The bar graphs show the percentage of S. Typhimurium localized with Cathepsin D (e) or M6PR (f) in pcDNA3.1- or pcDNA3.1-PIT1-transfected cells. Data indicate means ± SD (n = 3 slides). The significant differences are represented by p-values determined with Student’s t test.

