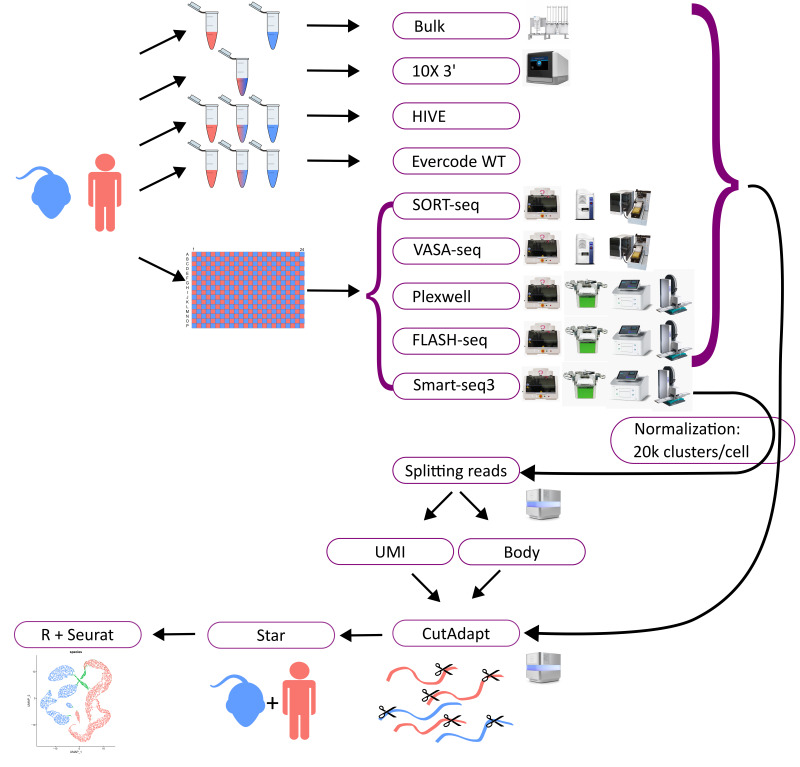
Figure 1.
Overview methods: the diagram depicts the workflow. Mouse and human cells were utilized for all methods. Cells were applied separately or mixed for some of the workflows (bulk RNAseq, 10X, HIVE), or were sorted into a well plate (96 or 384) in a checker-board pattern, alternating human (red) and mouse (blue) cells (for Smart-seq3, PlexWell, FLASH-seq, VASA-seq, and SORT-seq). All workflows utilized various equipment, depicted next to the workflows, except for HIVE, which is a self-contained workflow. All samples were afterwards sequenced on an Illumina sequencer and normalized to 20,000 reads per cell on average. The data were then trimmed with CutAdapt, mapped with Star, and analyzed with Seurat. For Smart-seq3, the UMI and body reads were divided and analyzed separately.

