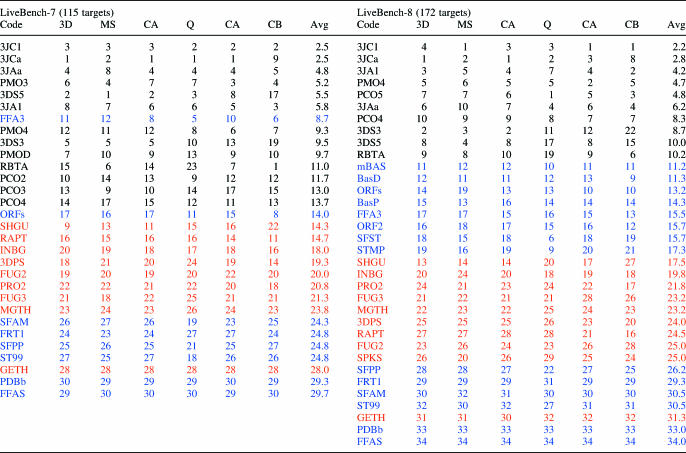
Table 4.
Comparison of rankings obtained using different evaluation measures
Only publicly available servers participating in LiveBench-8 that provide a description of the underlying algorithm are listed. Results obtained in LiveBench-7 are also displayed if available. Servers are colored blue (sequence only methods), red (hybrid methods) and black (structure meta predictors). The ‘Code’ column shows the code of the method as provided in Table 1. Rankings of servers obtained using five different assessment measures (see Table 2): 3D-score, MaxSub, CA-atoms<3 Å, Q(CA-atoms<3 Å), Contact(A) and Contact(B) are shown in columns ‘3D’, ‘MS’, ‘CA’, ‘Q’, ‘CA’ and ‘CB’, respectively. The ‘Avg’ column prints the average ranking of the server.

