Figure 2.
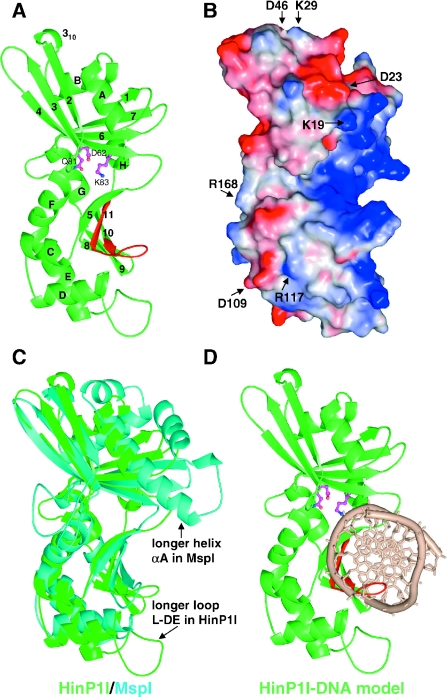
Structure of HinP1I (A) Ribbon representation. Helices are labeled as letters A–H and strands labeled as numbers 1–11 from N- to C-termini. Putative catalytic residues are shown in magenta color. The C-terminal β-hairpin, colored in red, contains the invariant residues (presumably involved in DNA base specific interactions) between HinP1I and MspI. (B) Molecular surface representation, shown in the same orientation of (A). The surface is colored blue for positive, red for negative and white for neutral. The basic (blue) concave surface, shown on the right side of the molecule, represents a DNA-binding surface. Several conserved charged residues (labeled) are scattered throughout the surface. R168, shown on the left side of the molecule, represents a potential dimer interface (see Figure 5B). (C) Superimposition of HinP1I (green) and MspI (cyan). (D) A model of HinP1I monomer docked with DNA.

